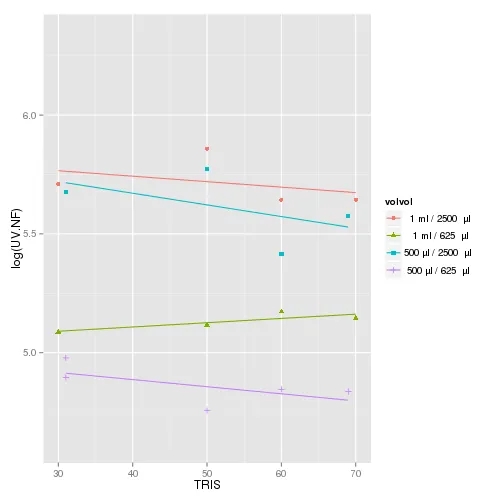
我做了以下这张图:
> ddd
UV.NF TRIS volvol
2 145.1923 31 500 µl / 625 µl
3 116.3462 50 500 µl / 625 µl
4 127.1635 60 500 µl / 625 µl
5 125.9615 69 500 µl / 625 µl
6 162.0192 30 1 ml / 625 µl
7 166.8269 50 1 ml / 625 µl
8 176.4423 60 1 ml / 625 µl
9 171.6346 70 1 ml / 625 µl
19 292.3077 31 500 µl / 2500 µl
20 321.1538 50 500 µl / 2500 µl
21 225.0000 60 500 µl / 2500 µl
22 263.4615 69 500 µl / 2500 µl
23 301.9231 30 1 ml / 2500 µl
24 350.0000 50 1 ml / 2500 µl
25 282.6923 60 1 ml / 2500 µl
26 282.6923 70 1 ml / 2500 µl
35 133.6207 31 500 µl / 625 µl
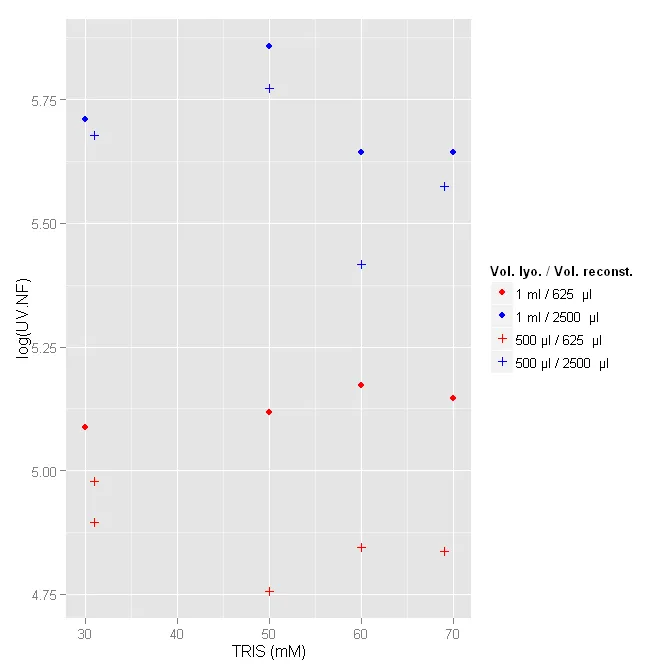
ggplot() +
geom_point(aes(y = log(UV.NF), x = TRIS, colour=ddd[,"volvol"], shape=ddd[,"volvol"]),
data=ddd) +
labs(colour = "volvol", shape="volvol") + xlab("TRIS (mM)") +
guides(colour = guide_legend(title="Vol. lyo. / Vol. reconst."),
shape=guide_legend(title="Vol. lyo. / Vol. reconst.")) +
scale_shape_manual(values = c(19,19,3,3)) + scale_colour_manual(values = c(2,4,2,4))
我想为图例中出现的四个组别中的每个组别添加回归线lm(y~x)。我已经尝试了许多次使用geom_smooth(),但没有成功。