在facet_wrap中设置“空格”,就像在facet_grid中一样。

22
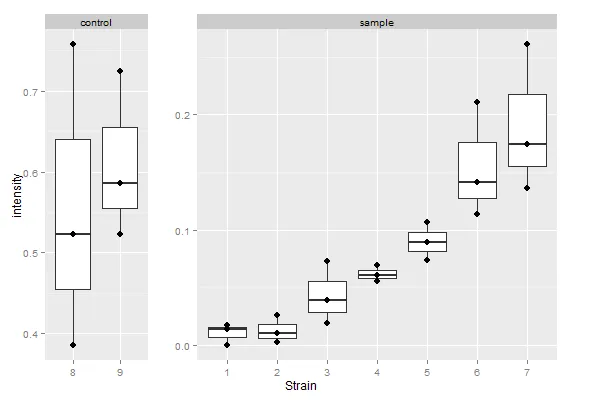
我需要不同宽度的分面; 左侧图显示实验的动态范围,右侧图显示测试条件。是否有办法在facet_wrap中同时拥有自由的x和y比例尺? 在facet_grid中可能是可能的,但即使使用scale="free",也会有一个固定的y比例尺。facet_wrap允许自由的y比例尺,但x比例尺似乎是固定的。几年前在Google页面上发布了同样的问题,但答案令人不满意。 https://groups.google.com/forum/#!topic/ggplot2/1RwkCcTRBAw 如果这里重复了,请见谅;非常感谢任何帮助!
mdf <- read.table(text="
   strain val     type
1       1 0.0000  sample
2       1 0.0140  sample
3       1 0.0175  sample
4       2 0.0025  sample
5       2 0.0260  sample
6       2 0.0105  sample
7       3 0.0190  sample
8       3 0.0725  sample
9       3 0.0390  sample
10      4 0.0560  sample
11      4 0.0695  sample
12      4 0.0605  sample
13      5 0.0735  sample
14      5 0.1065  sample
15      5 0.0890  sample
16      6 0.1135  sample
17      6 0.2105  sample
18      6 0.1410  sample
19      7 0.1360  sample
20      7 0.2610  sample
21      7 0.1740  sample
22      8 0.3850 control
23      8 0.7580 control
24      8 0.5230 control
25      9 0.5230 control
26      9 0.5860 control
27      9 0.7240 control")

library(ggplot2)

p<-ggplot(mdf, aes(reorder(strain, val), val))+
  labs(x="Strain", y="intensity")+
  geom_boxplot()+
  geom_point()+
  facet_grid(~type, scales ="free", space="free_x")
p
##  free x, fixed y.  why?

q<-ggplot(mdf, aes(reorder(strain, val), val))+
  labs(x="Strain", y="intensity")+
  geom_boxplot()+
  geom_point()+
  facet_wrap(~type, scales ="free")
q
##  free y, fixed x.  why?
4个回答

18

我不能绝对确定,但我认为答案是否定的 - 用ggplot2命令。我也不认为这是一个好主意,因为读者可能很难看出y轴上的刻度是不同的。然而,如果你一定要有这个图,你可以使用ggplot grob布局调整q plot面板的宽度。请注意,第一个面板有两个x值,第二个面板有七个x值。因此将面板的默认宽度分别更改为2null和7null。

编辑:更新到ggplot2 2.2.0

library(ggplot2)
library(grid)
# get mdf data frame from the question

# Your q plot
q <- ggplot(mdf, aes(factor(strain), val)) +
  labs(x = "Strain", y = "intensity") +
  geom_boxplot() +
  geom_point() +
  facet_wrap( ~ type, scales = "free")
q

# Get the ggplot grob
gt = ggplotGrob(q)

# Check for the widths - you need to change the two that are set to 1null
gt$widths
# The required widths are 4 and 8

# Replace the default widths with relative widths:
gt$widths[4] = unit(2, "null")
gt$widths[8] = unit(7, "null")

# Draw the plot
grid.newpage()
grid.draw(gt)

# I think it is better to have some extra space between the two panels
gt$widths[5] = unit(1, "cm")
grid.newpage()
grid.draw(gt)

或者使用 R 来确定相对宽度和面板。

gt = ggplotGrob(q)

# From 'dfm', get the number of 'strain' for each 'type'.
# That is, the number x-breaks in each panel.
library(dplyr)
N <- mdf %>% group_by(type) %>% 
     summarise(count = length(unique(strain))) %>% 
     `[[`(2)

# Get the column index in the gt layout corresponding to the panels.
panelI <- gt$layout$l[grepl("panel", gt$layout$name)]

# Replace the default panel widths with relative heights.
gt$widths[panelI] <- unit(N, "null")

# Add extra width between panels (assuming two panels)
gt$widths[panelI[1] + 1] = unit(1, "cm")

## Draw gt
grid.newpage()
grid.draw(gt)

输入图片描述


谢谢,这真的非常理想。这种解决方法是我见过的处理“ggplot中的双刻度”或“可变面”的问题最顺畅的方法。我希望其他人也会觉得有帮助。 - NWaters

5
此外,对于那些试图在dplyr中使用@Sandy的答案的人:
library(dplyr)
N<-mdf%>% group_by(type)%>% summarise(count = length(unique(strain)))

# Get the column index in the gt layout corresponding to the panels.
panelI <- gt$layout$l[grepl("panel", gt$layout$name)]

# Replace the default panel widths with relative heights.
gt$widths[panelI] <- lapply(N$count, unit, "null")

0

使用ggh4x::facet_grid2可以实现这一点。

ggplot(mdf, aes(reorder(strain, val), val))+
  labs(x="Strain", y="intensity")+
  geom_boxplot()+
  geom_point()+
  ggh4x::facet_grid2(~type, scales ="free", space="free_x", independent = "y")

使用reprex v2.0.2于2023年2月11日创建


0

对于在2023年寻找这个解决方案的任何人,Thomas Lin Pedersen的ggplot2扩展包extension中的facet_row()以及ggforce将非常好地处理这个问题。

library(ggplot2)
library(ggforce)

mdf <- read.table(
  text = "
             strain val     type
          1       1 0.0000  sample
          2       1 0.0140  sample
          3       1 0.0175  sample
          4       2 0.0025  sample
          5       2 0.0260  sample
          6       2 0.0105  sample
          7       3 0.0190  sample
          8       3 0.0725  sample
          9       3 0.0390  sample
          10      4 0.0560  sample
          11      4 0.0695  sample
          12      4 0.0605  sample
          13      5 0.0735  sample
          14      5 0.1065  sample
          15      5 0.0890  sample
          16      6 0.1135  sample
          17      6 0.2105  sample
          18      6 0.1410  sample
          19      7 0.1360  sample
          20      7 0.2610  sample
          21      7 0.1740  sample
          22      8 0.3850 control
          23      8 0.7580 control
          24      8 0.5230 control
          25      9 0.5230 control
          26      9 0.5860 control
          27      9 0.7240 control
        "
)

p <-
  ggplot(mdf, aes(reorder(strain, val), val)) +
  geom_boxplot() +
  geom_point() +
  ggforce::facet_row(
    facets = vars(type),
    scales = "free",
    space  = "free"
  ) +
  labs(x = "Strain", y = "intensity")

p


网页内容由stack overflow 提供, 点击上面的
可以查看英文原文,
原文链接