我在我的一个VB.NET项目中使用了MSChart控件。我决定将下表中的数据显示为饼图。
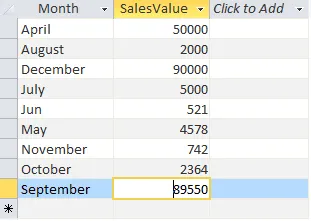
但是标签会相互重叠,为了解决这个问题,我尝试了以下“智能标签”属性:
Chart1.Series("Default").SmartLabelStyle.Enabled = True
Chart1.Series("Default").SmartLabelStyle.AllowOutsidePlotArea = LabelOutsidePlotAreaStyle.No

Chart1.Series("Default").SmartLabelStyle.CalloutLineAnchorCapStyle = LineAnchorCapStyle.None

Chart1.Series("Default").SmartLabelStyle.CalloutLineColor = Color.Red

Chart1.Series("Default").SmartLabelStyle.CalloutLineWidth = 1
Chart1.Series("Default").SmartLabelStyle.CalloutStyle = LabelCalloutStyle.None
但是它并没有帮助我...尽管它按照以下屏幕截图显示了输出。
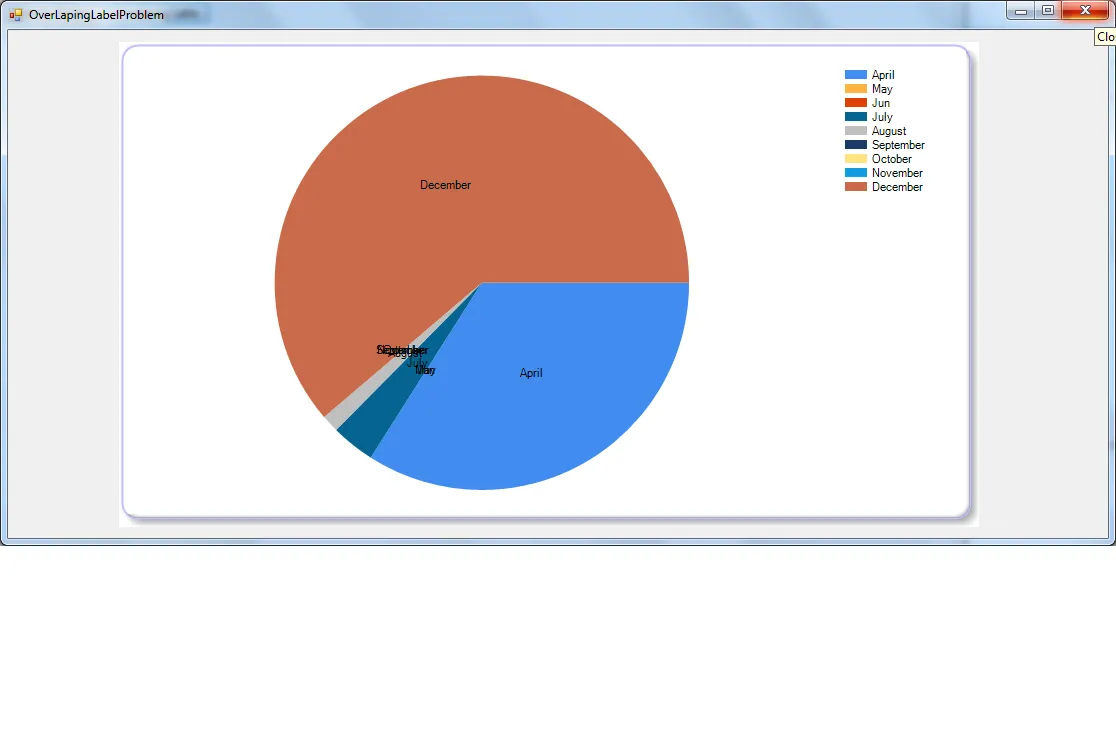
我应该使用哪些属性来摆脱它?......
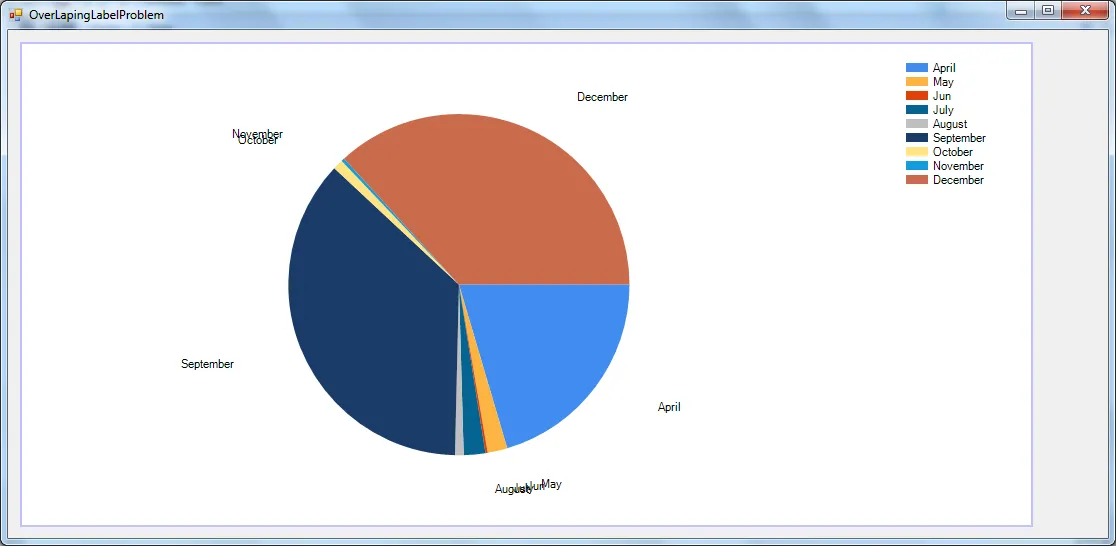
编辑:
如果我设置自定义属性PieLabelStyle=Outside,它并没有任何区别,如下面的屏幕截图所示。
请帮助我。