有人能告诉我如何在MSChart上显示总收集量吗?
有人能告诉我如何在MSChart上显示总收集量吗?
chart.Annotations 属性来获得类似的结果。var ann = new RectangleAnnotation();
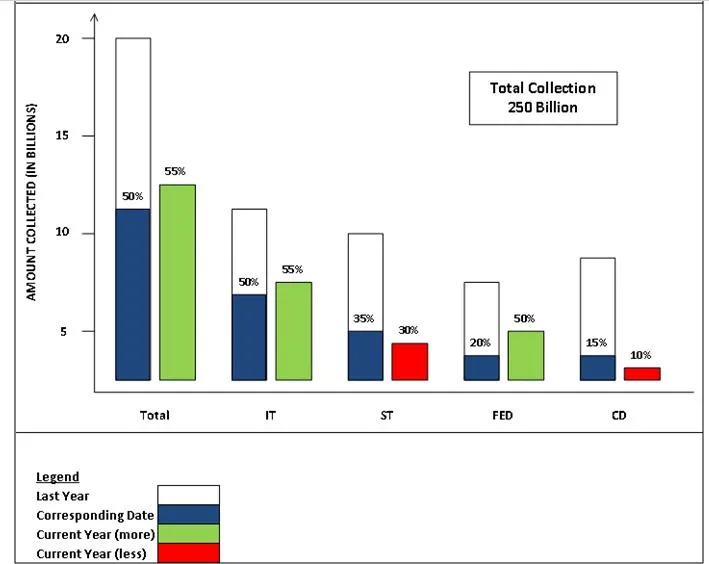
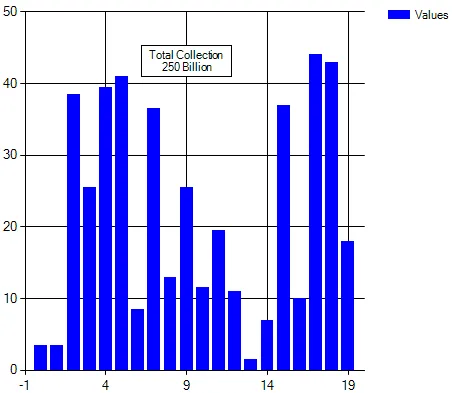
ann.Text = "Total Collection" + Environment.NewLine + "250 Billion";
ann.IsMultiline = true;
ann.AxisX = this.chart1.ChartAreas[0].AxisX;
ann.AxisY = this.chart1.ChartAreas[0].AxisY;
ann.AnchorX = 9; // as you can see from the image below,
ann.AnchorY = 41; // these values are inside the range
// add the annotation to the chart annotations list
this.chart1.Annotations.Add(ann);
CalloutAnnotation、EllipseAnnotation...),它们都有很多属性可以改变样式和行为。您甚至可以设置一个属性来允许注释移动(即AllowMoving=true)。IsDockedInsideChartArea设置为true。你还需要指定图表区域停靠的图例,并将位置属性设置为Auto。legend.IsDockedInsideChartArea = true;
legend.DockedToChartArea = "ChartArea1";
关于此属性以及其他图例属性的更多信息在这里。