在Matplotlib中,我如何更改LaTeX符号的字体大小?
以下是我的代码:
以下是我的代码:
import matplotlib.pyplot as plt
import seaborn as sns

# get x and y from file

plt.plot(x, y,  linestyle='--', marker='o', color='b')
plt.xlabel(r'$\alpha$ (distance weighted)', fontsize='large')
plt.ylabel('AUC')
plt.show()
但我得到了以下的图表:
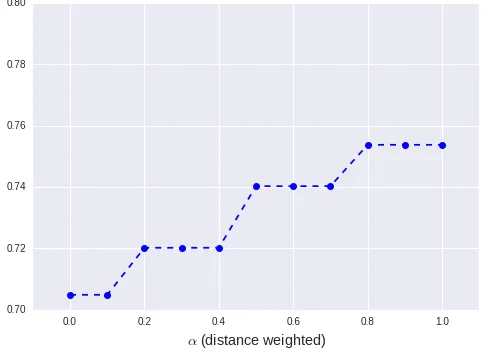
请注意,$\alpha$ 仍然很小。
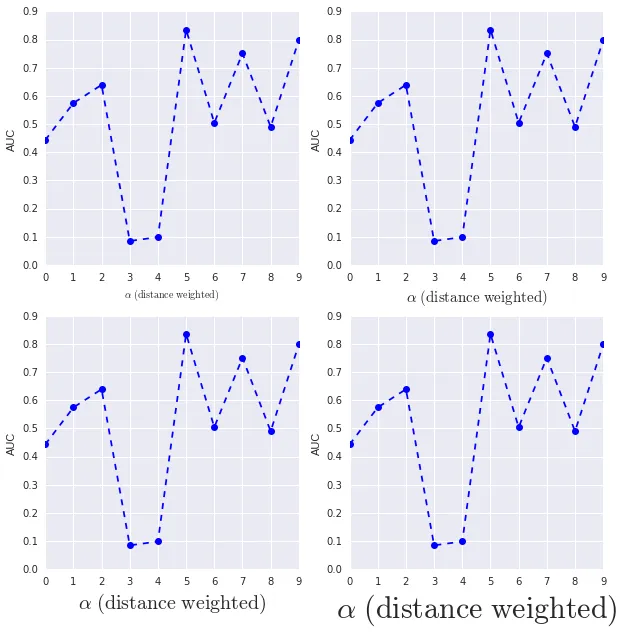
r'$\alpha\/\mathsf{(distance\/weighted)}$'。 - mwaskom