在使用pandas.DataFrame.plot()绘制DataFrame时,是否有一种控制网格格式的方法?
具体来说,我希望在绘制具有DateTimeIndex x轴的DataFrame时显示次要网格线。
这可以通过DataFrame.plot()实现吗?
df = pd.DataFrame.from_csv(csv_file, parse_dates=True, sep=' ')
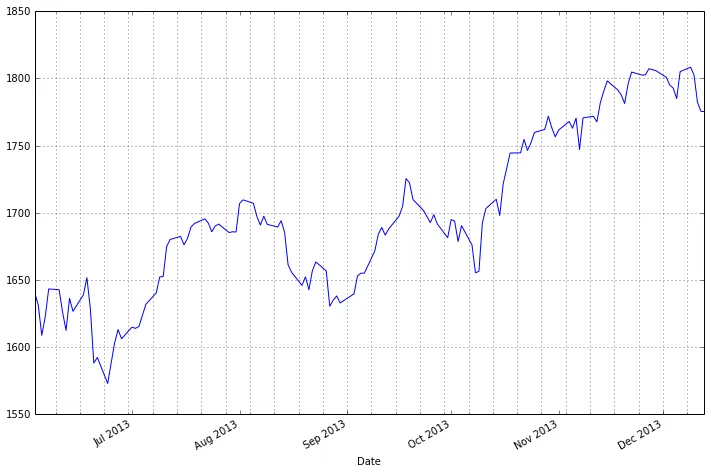
这将以每周频率绘制S&p500的小刻度和网格线:
import pandas.io.data as web
ts = web.DataReader("^GSPC", "yahoo", start=dt.date( 2013, 6, 1 ))[ 'Adj Close' ]

ax = ts.plot()
xtick = pd.date_range( start=ts.index.min( ), end=ts.index.max( ), freq='W' )
ax.set_xticks( xtick, minor=True )
ax.grid('on', which='minor', axis='x' )
ax.grid('off', which='major', axis='x' )
DataFrame.plot() 应该返回一个由 matplotlib 提供的 Axes 对象。
因此,使用 ax = df.plot(...),您可以进行以下操作:
ax.xaxis.grid(True, which='minor', linestyle='-', linewidth=0.25, ...)
df.index.min()应该也可以工作,除非它是多重索引。 - behzad.nouri