tmap R - 将专题图标题的字体从普通改为斜体,但保持图例字体为普通

7
我希望使用 R 中的 tmap 包将主题绘图的主标题字体从“plain”更改为“italics”,但保留图例标题和文本的字体“plain”。然而,当我在 lm_layout() 函数中更改 fontface 参数时,它会更改地图中所有文本的字体。是否可能仅更改tmap中主标题的字体?以下是我尝试创建可重现示例(不幸的是,它将地图中所有文本的字体更改为“italics”):
library(tmap)
data("World")

tm_shape(World) +
tm_polygons("HPI", title = "World - HPI") +
  tm_layout(main.title = "HPI",
            main.title.position = "center",
            fontface = 3) 

修改:tmap包的作者Martijn Tennekes已经为tm_layout(因此也是tmap选项)添加了10个参数,以允许对地图标题、主标题、面板标签、图例标题和图例文本使用本地字体和字族进行控制。

tm <- tm_shape(World) +
tm_polygons(c("HPI", "economy"), title = c("Legend 1", "Legend 2")) +
tm_layout(main.title = "Main Title",
          main.title.position = "center",
          title = c("Title 1", "Title 2"),
          panel.labels = c("Panel 1", "Panel 2"))

# global setting
tm + tm_layout(fontface = 3) 

# local setting
tm + tm_layout(main.title.fontface = 1, title.fontface = 2, panel.label.fontface = 3, legend.text.fontface = 4, legend.title.fontfamily = "serif")

据我所知,
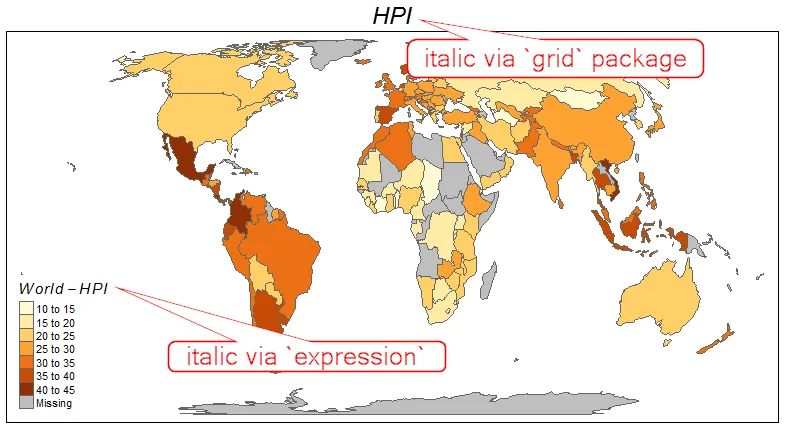
fontface参数是全局的,它覆盖地图中的所有文本。 - Jindra Lacko
这是一个有趣的问题 - 据我所知,唯一的解决方案是通过在ggplot中使用geom_sf()绘制静态地图(具有相当先进的格式),或者通过leaflet绘制动态地图,它允许HTML标记。 - Jindra Lacko
谢谢回复。我已经使用了其他_R_包来绘制地图,包括rasterrasterVisggplot2,现在我想尝试使用tmap,因为它具有许多很好的功能,例如易于格式化并且无需转换为数据框。main.title中使用_斜体_是为了标记物种的学名,而'plain'文本似乎更适用于图例。我发现修改图例标题为普通标题的一种可行方法是,在新标题周围加上'expression',例如expression("World - HPI")。但不确定如何将其余的图例文本更改为普通文本。 - sjarvie
2
随着此事的跟进,我在Github网站上创建了该问题。tmap的作者Martijn随后添加了10个参数到tm_layout(因此也是tmap选项),以更改字体。这些选项包括:地图标题、主标题、面板标签、图例标题和图例文本的本地字体和字体族。现在这让字体有了更好的控制。 - sjarvie
感谢您,Jinda。希望您也觉得这些更改有用。 - sjarvie
显示剩余4条评论
1个回答

2

已测试版本为tmap_2.1-1

虽然在tm_polygons中图例标题可以通过title = expression(italic(your-text))设置为斜体,但似乎绘图标题不允许使用expression。一种解决方法是利用grid包的编辑功能:

library(tmap)
library(grid)

data("World")

tm_shape(World) +
  tm_polygons("HPI", title = expression(italic(World - HPI))) + # set legend title to italic
  tm_layout(main.title = "HPI", # unfortunately, does not allow `expression`; try the `grid` hack
            main.title.position = "center") 

# Convert to gTree/list of grobs
g <- grid.grab()
View(g) # check the structure of the gTree; helps with identifying graphical elements
# Edit the fontface of the main title - from 1 (plain text) to 3 (italic); must be integer
g[["children"]][[1]][["children"]][["main_title"]][["children"]][[1]][["gp"]][["font"]] <- 3L
# Draw the edited gTree
grid.newpage(); grid.draw(g)

enter image description here


感谢Valentin。tmap的作者Martijn在tm_layout(因此也是tmap选项)中添加了10个参数,以更改字体。它们包括:地图标题、主标题、面板标签、图例标题和图例文本的本地字体和字体系列。这现在可以很好地控制字体。 - sjarvie
嗨@sjarvie!做得很好!我鼓励你用提到的更新回答自己的问题。拿出你最初的代码,加上解决问题的新'tm_layout'参数。 - Valentin_Ștefan
嗨,瓦伦丁,好建议!我已经编辑了我的原始帖子以添加这些信息。谢谢。 - sjarvie

网页内容由stack overflow 提供, 点击上面的
可以查看英文原文,
原文链接