使用自定义颜色调色板反转传单图例值

3

我正在尝试结合两个在StackOverflow上经常讨论的问题:

  • 如何为零上/零下的值创建自定义颜色调色板,以及;
  • 如何在leafletOutput中反转图例

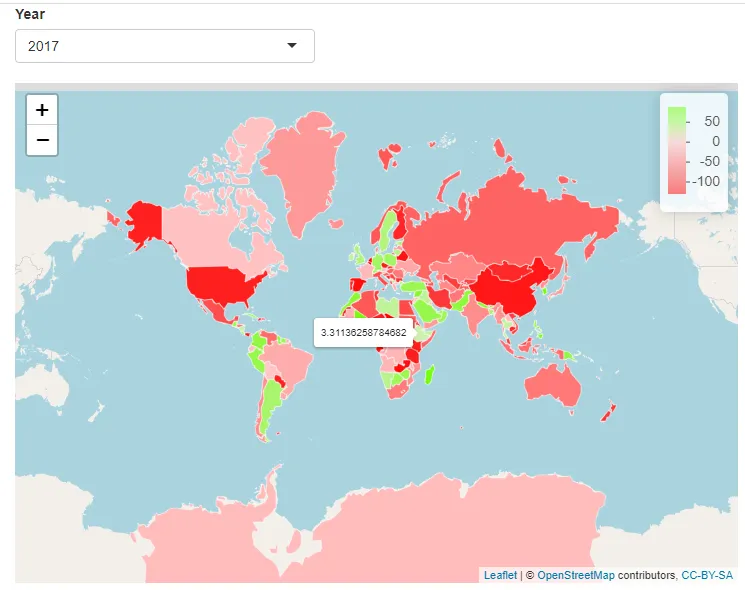
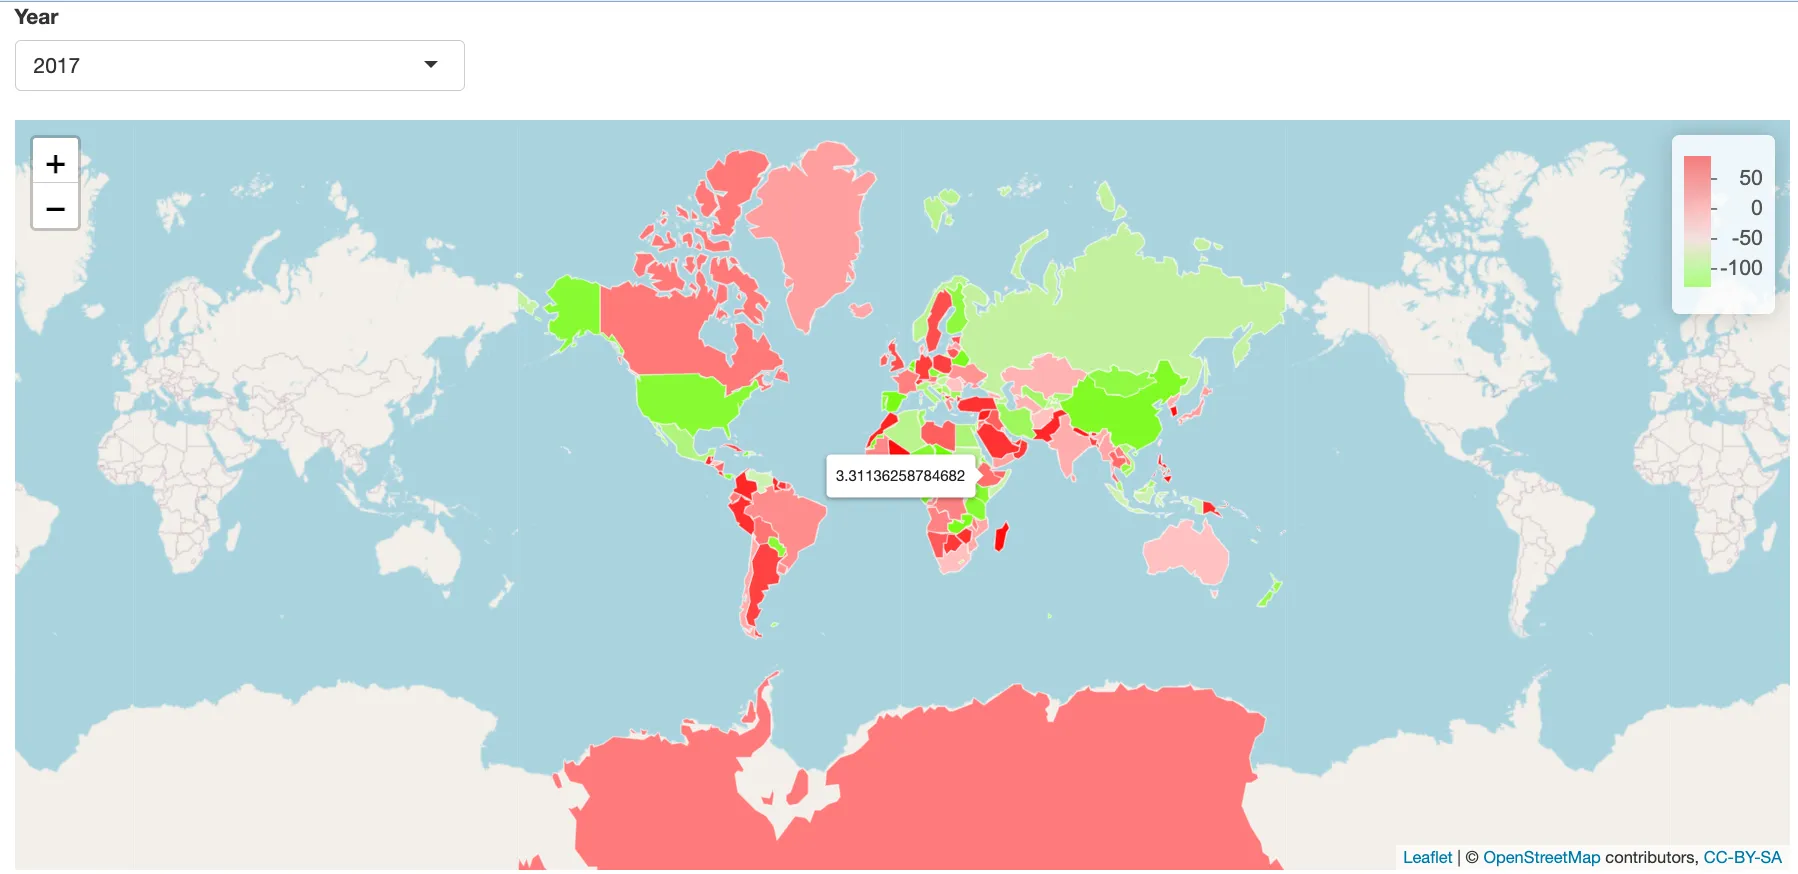
我已经接近成功了,实际多边形的颜色是正确的,但图例还不太正确: enter image description here

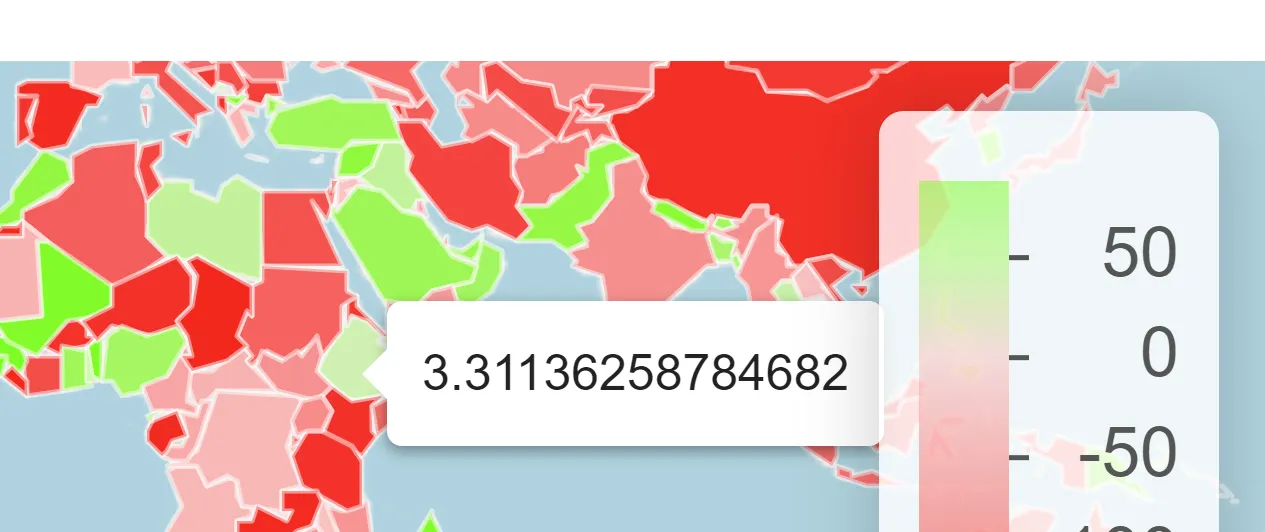
你可以看到,如果从下拉菜单中选择2017年,悬停在多边形上的颜色是正确的,但图例中的颜色比例尺不正确。

图例中的颜色应该在0处相交,但目前并没有。

我认为这与反转有关,因为如果使用常规调色板,它是正确的,但我需要图例按降序排列。

我该如何修复这个问题?

可复现的代码:

library(shiny)
library(leaflet)
library(tidyverse)

set.seed(999)

# Read in the countries data for the geometry
countries <- sf::st_read("https://rstudio.github.io/leaflet/json/countries.geojson")


# Modify for purposes
countries_mod <- countries %>%
  # Drop actual values
  select(-gdp_md_est, -pop_est) %>%
  # Create random example data
  mutate(
    `2017` = runif(177, -140, 80),
    `2018` = runif(177, -20, 70),
    `2019` = runif(177, -288, 1400)
  ) %>%
  # Pivot into long format for mapping
  pivot_longer(cols = c(`2017`:`2019`))


ui <- fluidPage(
  
  selectInput(
    inputId = "year_select",
    label = "Year",
    choices = c("2017", "2018", "2019")
  ),
  
  leafletOutput("plot", height = "500px")
   
)

server <- function(input, output) {
  
  # Filter the data by year
  Filtered_dat <- reactive({
    countries_mod %>%
      filter(name == input$year_select)
  })
  
  output$plot <- renderLeaflet({
    leaflet(countries) %>%
      addTiles()
  })

  
  observeEvent(Filtered_dat(), {
    
    # Colours for data less than 0 (use abs to get non-negative value)
    colors_negative <- colorRampPalette(c("#fe0000", "#fFc7c7"))(abs(min(Filtered_dat()$value)))
    # Colours for data greater than 0 
    colors_positive <- colorRampPalette(c("#d0f0b7", "#6dfe00"))(max(Filtered_dat()$value))
    
    # Create the palette
    pal <- colorNumeric(c(colors_negative, colors_positive), domain = Filtered_dat()$value)
    
    # Create the reversed palette 
    rev_pal <- colorNumeric(c(colors_negative, colors_positive), domain = Filtered_dat()$value, reverse = TRUE)
    
    leafletProxy("plot") %>%
      setView(0, 0, 1) %>%
      # Remove the old polygons
      clearShapes() %>%
      addPolygons(
        data = Filtered_dat(),
        label = ~value,
        fillColor = ~pal(Filtered_dat()[["value"]]),
        fillOpacity = 1,
        color = "#FEFEFE",
        weight = 1
      ) %>%
      # Remove old legend before redrawing
      clearControls() %>%
      addLegend(
        pal = rev_pal,
        values = Filtered_dat()$value,
        labFormat = labelFormat(transform = function(x) sort(x, decreasing = TRUE))
      )
    
  })
}

shinyApp(ui = ui, server = server)
2个回答

0
要在图例中颠倒颜色,您可以定义
rev_pal <- colorNumeric(c(colors_negative,colors_positive), domain = rev(Filtered_dat()$value), reverse = TRUE)
    

然后你得到

output


还是不正确,正如你在图例中所看到的,颜色应该在零点相交。 - undefined
@anorlondo,请尝试更新后的答案。 - undefined
跟我之前发布的一模一样。图例中的颜色应该在0处相交。 - undefined

0
如果你想要颜色反转,你应该交换正向和负向颜色向量的顺序,并且使用rev函数来获取较暗的颜色作为最大和最小值,就像这样:
library(shiny)
library(leaflet)
library(tidyverse)

set.seed(999)

# Read in the countries data for the geometry
countries <- sf::st_read("https://rstudio.github.io/leaflet/json/countries.geojson")


# Modify for purposes
countries_mod <- countries %>%
  # Drop actual values
  select(-gdp_md_est, -pop_est) %>%
  # Create random example data
  mutate(
    `2017` = runif(177, -140, 80),
    `2018` = runif(177, -20, 70),
    `2019` = runif(177, -288, 1400)
  ) %>%
  # Pivot into long format for mapping
  pivot_longer(cols = c(`2017`:`2019`))


ui <- fluidPage(
  
  selectInput(
    inputId = "year_select",
    label = "Year",
    choices = c("2017", "2018", "2019")
  ),
  
  leafletOutput("plot", height = "500px")
  
)

server <- function(input, output) {
  
  # Filter the data by year
  Filtered_dat <- reactive({
    countries_mod %>%
      filter(name == input$year_select)
  })
  
  output$plot <- renderLeaflet({
    leaflet(countries) %>%
      addTiles()
  })
  
  
  observeEvent(Filtered_dat(), {
    
    # Colours for data less than 0 (use abs to get non-negative value)
    colors_negative <- colorRampPalette(c("#fe0000", "#fFc7c7"))(abs(min(Filtered_dat()$value)))
    # Colours for data greater than 0 
    colors_positive <- colorRampPalette(c("#d0f0b7", "#6dfe00"))(max(Filtered_dat()$value))
    
    # Create the palette
    pal <- colorNumeric(c(rev(colors_positive), rev(colors_negative)), domain = Filtered_dat()$value)
    
    # Create the reversed palette 
    rev_pal <- colorNumeric(c(rev(colors_positive), rev(colors_negative)), domain = Filtered_dat()$value, reverse = TRUE)
    
    leafletProxy("plot") %>%
      setView(0, 0, 1) %>%
      # Remove the old polygons
      clearShapes() %>%
      addPolygons(
        data = Filtered_dat(),
        label = ~value,
        fillColor = ~pal(Filtered_dat()[["value"]]),
        fillOpacity = 1,
        color = "#FEFEFE",
        weight = 1
      ) %>%
      # Remove old legend before redrawing
      clearControls() %>%
      addLegend(
        pal = rev_pal,
        values = Filtered_dat()$value,
        labFormat = labelFormat(transform = function(x) sort(x, decreasing = TRUE))
      )
    
  })
}

shinyApp(ui = ui, server = server)

输出:

enter image description here


不正确;颜色应该在零点相遇,而在你的解决方案中,它们也是颠倒的。 - undefined

网页内容由stack overflow 提供, 点击上面的
可以查看英文原文,
原文链接