如何在Chart.js中指定“每个数据集”解析?

5
我正在尝试使用ChartJS中的yAxisKey选项来指定数据集,但我在复制文档中的示例时遇到了问题。我已经尝试搜索与yAxisKey(或xAxisKey)、parsing选项以及指定datasets的一般信息相关的问题,但到目前为止都没有找到有用的信息。
<!doctype html>
<html>
<head>
    <title>Example Chart</title>
    <script src="https://cdn.jsdelivr.net/npm/chart.js@2.8.0"></script>
</head>

<body>
    <canvas id="canvas"></canvas>
    <script>
        const data = [{x: 'Jan', net: 100, cogs: 50, gm: 50}, {x: 'Feb', net: 120, cogs: 55, gm: 75}];
        const config = {
                type: 'bar',
                data: {
                    labels: ['Jan', 'Feb'],
                    datasets: [{
                        label: 'Net sales',
                        data: data,
                        parsing: {
                            yAxisKey: 'net'
                        }
                    }, {
                        label: 'Cost of goods sold',
                        data: data,
                        parsing: {
                            yAxisKey: 'cogs'
                        }
                    }, {
                        label: 'Gross margin',
                        data: data,
                        parsing: {
                            yAxisKey: 'gm'
                        }
                    }]
                },
            };

        window.onload = function() {
            const ctx = document.getElementById('canvas').getContext('2d');
            let chart  = new Chart(ctx, config);
        };
    </script>
</body>
</html>

我看到的图表是空白的。

空图表结果的屏幕截图

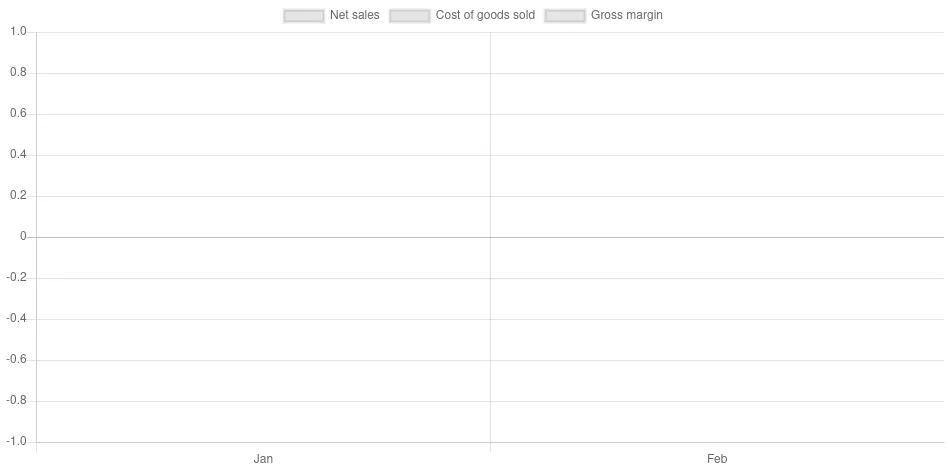
我是否忽略了一些明显的东西? 是否误解了语法?

提前感谢!

3个回答

8

由于您当前使用的Chart.js版本为2.8.0,因此尚未提供每个数据集的parsing选项,但您仍然可以通过Array.map()函数获得相同的结果。

请查看您改进后的代码并查看其工作原理。

<!doctype html>
<html>

<head>
  <title>Example Chart</title>
  <script src="https://cdn.jsdelivr.net/npm/chart.js@2.8.0"></script>
</head>

<body>
  <canvas id="canvas"></canvas>
  <script>
    const data = [
      { x: 'Jan', net: 100, cogs: 50, gm: 50 }, 
      { x: 'Feb', net: 120, cogs: 55, gm: 75 }
    ];
    const config = {
      type: 'bar',
      data: {
        labels: data.map(o => o.x),
        datasets: [{
          label: 'Net sales',
          data: data.map(o => o.net)
        }, {
          label: 'Cost of goods sold',
          data: data.map(o => o.cogs)
        }, {
          label: 'Gross margin',
          data: data.map(o => o.gm)
        }]
      },
      options: {
        scales: {
          yAxes: [{
            ticks: {
              beginAtZero: true
            }
          }]
        }
      }
    };

    window.onload = function() {
      const ctx = document.getElementById('canvas').getContext('2d');
      let chart = new Chart(ctx, config);
    };
  </script>
</body>

</html>


啊,太糟糕了。那我就用 map 吧。谢谢! - Anne

3

显然,这个每个数据集的parsing选项只在即将发布的Chart.js版本3.0.0中可用。但当前的稳定版本是2.9.3。

请查看下面的代码,并查看它如何与Chart.js 3.0.0 alpha-2一起工作。

<!doctype html>
<html>
<head>
    <title>Example Chart</title>
    <script src="https://cdnjs.cloudflare.com/ajax/libs/Chart.js/3.0.0-alpha.2/chart.min.js"></script>
</head>

<body>
    <canvas id="canvas"></canvas>
    <script>
        const data = [{x: 'Jan', net: 100, cogs: 50, gm: 50}, {x: 'Feb', net: 120, cogs: 55, gm: 75}];
        const config = {
                type: 'bar',
                data: {
                    labels: ['Jan', 'Feb'],
                    datasets: [{
                        label: 'Net sales',
                        data: data,
                        parsing: {
                            yAxisKey: 'net'
                        }
                    }, {
                        label: 'Cost of goods sold',
                        data: data,
                        parsing: {
                            yAxisKey: 'cogs'
                        }
                    }, {
                        label: 'Gross margin',
                        data: data,
                        parsing: {
                            yAxisKey: 'gm'
                        }
                    }]
                },
            };

        window.onload = function() {
            const ctx = document.getElementById('canvas').getContext('2d');
            let chart  = new Chart(ctx, config);
        };
    </script>
</body>
</html>


-1

如果您替换CDN,现有代码就可以工作。


1
你的回答可以通过提供更多支持信息来改进。请编辑以添加进一步的细节,例如引用或文档,以便他人可以确认你的答案是正确的。您可以在帮助中心找到有关如何编写良好答案的更多信息。 - Community

网页内容由stack overflow 提供, 点击上面的
可以查看英文原文,
原文链接