在R中为每个组计算凸包

4

我有一个以下的数据集:

structure(list(time = c(1L, 1L, 1L, 1L, 1L, 2L, 2L, 2L, 2L, 2L, 
3L, 3L, 3L, 3L, 3L, 4L, 4L, 4L, 4L, 4L, 5L, 5L, 5L, 5L, 5L), 
x = c(40.8914337158203, 20.0796813964844, 13.9093618392944, 
17.1513957977295, 18.5109558105469, 40.7868537902832, 19.9750995635986, 
13.804780960083, 16.8376483917236, 18.4063758850098, 40.6822700500488, 
19.7659358978271, 13.7001991271973, 16.6284866333008, 18.3017921447754, 
40.5776901245117, 19.66135597229, 13.5956182479858, 16.3147411346436, 
18.1972122192383, 40.5776901245117, 19.5567722320557, 13.4910354614258, 
16.1055774688721, 17.9880485534668), y = c(0.603550314903259, 
-8.24852085113525, 9.65680503845215, -19.0118350982666, 6.43787002563477, 
0.704141974449158, -8.34911251068115, 9.75739574432373, -19.2130165100098, 
6.43787002563477, 0.704141974449158, -8.44970417022705, 9.75739574432373, 
-19.5147914886475, 6.43787002563477, 0.704141974449158, -8.65088748931885, 
9.85798835754395, -19.8165683746338, 6.33727836608887, 0.704141974449158, 
-8.85207080841064, 9.85798835754395, -20.1183433532715, 6.33727836608887
), object = c(1L, 2L, 3L, 4L, 5L, 1L, 2L, 3L, 4L, 5L, 1L, 
2L, 3L, 4L, 5L, 1L, 2L, 3L, 4L, 5L, 1L, 2L, 3L, 4L, 5L)), class = c("tbl_df", 
"tbl", "data.frame"), row.names = c(NA, -25L), .Names = c("time", 
"x", "y", "object"))

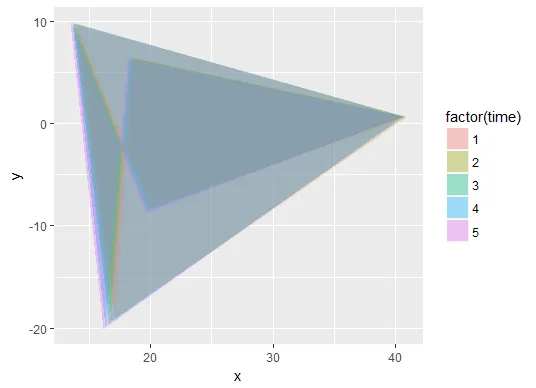
现在,我想为每个time的值计算凸包(使用chull函数),并将其存储在同一数据集中(因为我之后想用ggplot2进行绘图)。我可以使用with函数对每个时间值使用chull

chull(filter(data_sample, time == 1)$x, filter(data_sample, time == 1)$y)

该代码返回一个向量4 3 1。因此,我认为首先可以按时间分组,然后使用类似以下内容的方法计算组内的凸包点。

data_sample %>% group_by(time) %>% summarise(pts = chull(data_sample$x, data_sample$y))

问题在于我无法将向量存储在一行中。将每个顶点分别存储在不同的列中是一个选择,但以下方式可能更好:
data_sample %>% group_by(time) %>% summarise(pt1 = chull(data_sample$x, data_sample$y)[1])

不给出合理的结果。所以我的问题是: 1. 我该如何为每一行存储一个向量在一个列中?我已经读到tibble实际上可以有一个列表列,但是在我的情况下我该如何创建它? 2. 在每个组内计算chull时我的尝试出了什么问题?

  • (额外问题,如果可以的话) 为什么 data_sample %>% filter(time == 1) %>% chull(.$x, .$y) 不起作用?这是因为chull不支持管道的使用和吗?
3个回答

4

由于 chull 在原始数据上提供了索引,因此您可能希望在操作过程中保留坐标,这意味着您可能不应该使用 summarize。我建议您采用与 tidyr 相同的 "嵌套" 概念。第一步是嵌套您的数据:

library(tidyr)
data_sample %>%
  group_by(time) %>%
  nest()
# # A tibble: 5 × 2
#    time             data
#   <int>           <list>
# 1     1 <tibble [5 × 3]>
# 2     2 <tibble [5 × 3]>
# 3     3 <tibble [5 × 3]>
# 4     4 <tibble [5 × 3]>
# 5     5 <tibble [5 × 3]>

从这里开始,只需要计算外壳即可(它将返回一个索引向量),然后按提供的顺序输出相关行。这将受益于purrr提供的map函数:

library(purrr)
data_sample %>%    data_sample %>%
  group_by(time) %>%
  nest() %>%
  mutate(
    hull = map(data, ~ with(.x, chull(x, y))),
    out = map2(data, hull, ~ .x[.y,,drop=FALSE])
  )
# # A tibble: 5 × 4
#    time             data      hull              out
#   <int>           <list>    <list>           <list>
# 1     1 <tibble [5 × 3]> <int [3]> <tibble [3 × 3]>
# 2     2 <tibble [5 × 3]> <int [3]> <tibble [3 × 3]>
# 3     3 <tibble [5 × 3]> <int [3]> <tibble [3 × 3]>
# 4     4 <tibble [5 × 3]> <int [3]> <tibble [3 × 3]>
# 5     5 <tibble [5 × 3]> <int [3]> <tibble [3 × 3]>

你应该可以将两个赋值操作放在一个mutate函数中。从这里开始,你可以通过移除不必要的列和展开数据来得到所需的坐标:
data_sample %>%
  group_by(time) %>%
  nest() %>%
  mutate(
    hull = map(data, ~ with(.x, chull(x, y))),
    out = map2(data, hull, ~ .x[.y,,drop=FALSE])
  ) %>%
  select(-data) %>%
  unnest()
# # A tibble: 15 × 5
#     time  hull        x           y object
#    <int> <int>    <dbl>       <dbl>  <int>
# 1      1     4 17.15140 -19.0118351      4
# 2      1     3 13.90936   9.6568050      3
# 3      1     1 40.89143   0.6035503      1
# 4      2     4 16.83765 -19.2130165      4
# 5      2     3 13.80478   9.7573957      3
# 6      2     1 40.78685   0.7041420      1
# 7      3     4 16.62849 -19.5147915      4
# 8      3     3 13.70020   9.7573957      3
# 9      3     1 40.68227   0.7041420      1
# 10     4     4 16.31474 -19.8165684      4
# 11     4     3 13.59562   9.8579884      3
# 12     4     1 40.57769   0.7041420      1
# 13     5     4 16.10558 -20.1183434      4
# 14     5     3 13.49104   9.8579884      3
# 15     5     1 40.57769   0.7041420      1

为了演示,我在这里保留了hull;因为您已经有了所需内容,尤其是与object重复的部分,您可能可以在上面使用select(-data, -hull)

对于您的最后一个问题,您可以选择以下任何一种:

filter(data_sample, time == 1) %>%
  with(., chull(x, y))
with(filter(data_sample, time == 1), chull(x, y))

哇,正是我所需要的。非常感谢! - Kuba_

1
如果您不想使用列表列*,可以考虑使用(更灵活的)data.table
library(data.table)
setDT(d)
d[d[ , .I[chull(x, y)], by = time]$V1]

说明:将您的数据转换为data.tablesetDT(d))。对于每个时间(by = time),计算chull指数并选择相应的行(.I) (请参见here)。
如果您想绘制chull多边形,需要添加第一个索引以关闭多边形。
d2 <- d[ , {

  # for each time (by = time):
  # compute the indices lying on the convex hull  
  ix <- chull(x, y)

  # use indices to select data of each subset (.SD)
  # possibly also add the first coordinate to close the polygon for plotting   
  .SD[c(ix, ix[1])]}, by = time]


# plot chull and original polygons
library(ggplot2) 
ggplot(d2, aes(x, y, fill = factor(time))) +
  geom_polygon(alpha = 0.2) +
  geom_polygon(data = d, alpha = 0.2)

enter image description here


*相关的dplyr问题:使用可变长度输出的汇总动词, 控制summarise长度的可选参数


1
您可以简单地将chull函数放在列表中传递:

df <- df %>% 
  group_by(time) %>% 
  mutate(chull_val = list(chull(x,y)))

网页内容由stack overflow 提供, 点击上面的
可以查看英文原文,
原文链接