用图形方式表示Python字典

3
我需要一种将字典(或NumPy 2D数组)以图像形式表示的方法,可能类似于下面的图片。 Q-table 我的字典目前看起来像这样: Q: {(0,'U'): -0.1, (0,'R'): -0.254, (0,'D'): -0.9, (0,'L'): -0.23, ...} 其中U、R、D、L对应于方向,上、下、右、左
为了更好地理解,我希望可视化SARSA学习方法的Q表。我在Jupyter笔记本中运行它。 我将在总共100k个episode上运行SARSA,并希望每10k个episode运行后可视化Q表。
我想matplotlib可能能够做到这一点?但我对这种特定类型的表示不是很熟悉。
如果有人知道比这种特定的图像格式更好的表示Q表的方法,我也可以接受建议。我还可以将Q表表示为2D numpy数组,而不是字典,如果使用2D数组会更好。

非常感谢您提前的回复!

1个回答

3

我不知道Q-table是什么,但我花了很多时间试图可视化不同的东西。

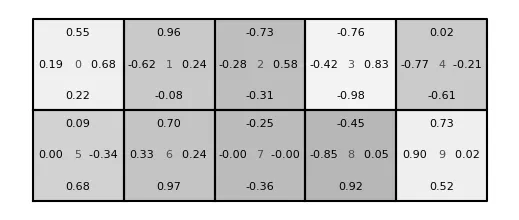
根据我对您问题的理解,您需要10个表格,我在下面的代码中将它们排列成2行5列的格子。也就是说,这段代码应该可以按您需要的任何数量进行扩展,希望如此。

我创建了一个字典,其中包含我认为可能出现在Q表格中的代表性值。希望我的假设足够接近,您可以使用以下代码来解决问题。

from matplotlib import pyplot as plt
import numpy as np

n_row = 2 # number of rows
n_col = 5 # number of columns

# Make up some dummy data
Q = {}
for m in range(n_row * n_col):
    Q[(m, 'U')] = 2 * np.random.random() - 1
    Q[(m, 'D')] = 2 * np.random.random() - 1
    Q[(m, 'L')] = 2 * np.random.random() - 1
    Q[(m, 'R')] = 2 * np.random.random() - 1


# Plotting paramters:
boxsize = 0.5 # box size in inches
fontcol = 'k' # color of your U/D/L/R values
centerfontcol = [0.3, 0.3, 0.3] # color of the box number in the center
fontsize = 4   # font size to use

maxalpha = 0.3 # just to make boxes different backgrounds as per your
               # example if you want them all white, then remove this
               # and the "fill" command below

# Create a figure. Note that the "figsize" command gives yout the dimensions of
# your figure, in inches
fig = plt.figure(figsize = (n_col * boxsize, n_row * boxsize))

# This creates an axes for plotting. If you imagine your figure
# "canvas" as having normal coordinates where the bottom left is (0,0)
# and the top right is (1,1), then the line below gives you an axis
# that fills the entire area. The values give [Left, Bottom,
# Width, Height].
ax = plt.axes([0, 0, 1, 1])

# These are spacings from the edges of each table used in setting the
# text
xspace = 0.2 / n_col
yspace = 0.15 / n_row


m = 0 # m is a counter that steps through your tables

# When stepping through each table, we set things up so that the
# limits of the figure are [0, 1] in the x-direction and the
# y-direction so values are normalized

for r in range(n_row):
    # top and bottom bounds of the table
    y1 = 1 - (r + 1) / n_row  
    y2 = 1 - r / n_row
    for c in range(n_col):
        # left and right bounds of the table
        x1 = c / n_col
        x2 = (c+1) / n_col

        # plot the box for the table
        plt.plot([x1, x1, x2, x2, x1], [y1, y2, y2, y1, y1], 'k')

        # fill the box for the table, if you want
        # fillalpha is just if you want the boxes different shades
        fillalpha = maxalpha * np.random.random()
        plt.fill([x1, x1, x2, x2, x1], [y1, y2, y2, y1, y1], 'k', alpha = fillalpha)

        # Put the values in
        # center
        plt.text((x1 + x2) / 2, (y1 + y2) / 2, "%i" % m,
                 color = centerfontcol, fontsize = fontsize, va = 'center', ha = 'center')

        # left
        plt.text(x1 + xspace, (y1 + y2) / 2, "%.2f" % Q[(m, 'L')],
                 color = fontcol, fontsize = fontsize, va = 'center', ha = 'center')
        # right
        plt.text(x2 - xspace, (y1 + y2) / 2, "%.2f " % Q[(m, 'R')],
                 color = fontcol, fontsize = fontsize, va = 'center', ha = 'center')

        # up
        plt.text((x1 + x2) / 2, y2 - yspace, "%.2f" % Q[(m, 'U')],
                 color = fontcol, fontsize = fontsize, va = 'center', ha = 'center')

        # down
        plt.text((x1 + x2) / 2, y1 + yspace, "%.2f" % Q[(m, 'D')],
                 color = fontcol, fontsize = fontsize, va = 'center', ha = 'center')
        
        # augment the counter
        m += 1
ax.set_axis_off()
plt.savefig("q-table.png", bbox_inches = "tight")

Example q-table


嘿,非常感谢!这对我有用 :) 我只是把它放在一个帮助函数里,并编辑了行和列以适应我的用例! - waffledood
只是一个问题,我看到了fill函数,它将会很有用,因为我希望只用相同的灰色/黑色来着色表格中的某些单元格,我该怎么做呢?我有一个包含特定单元格的列表,可以传递给我放置您代码的辅助函数。我知道这需要传递到plt.fill()中,但您能否快速向我展示一个例子呢?假设,boxes_to_color = [3, 5, 7] - waffledood
1
如果我理解正确的话,您有一个函数调用来处理每个框?如果是这种情况,您可以在末尾添加一个带有默认值的参数(例如 fill_color = None),然后在函数中,如果 fill_color 不是 None,则使用 plt.fill(....., color = fill_color) - ramzeek
嘿,没关系,我懂了!m 跟踪字典的索引。我只想着色来自 holes 的索引框。我尝试过使用 if (r*n_row+c*n_col) in holes,但是错误的索引框不知何故被着色了。 - waffledood

网页内容由stack overflow 提供, 点击上面的
可以查看英文原文,
原文链接