回答更新,12/22:根据Peter Shor的观察,不同截面之间存在同态映射和立方体上对象排列的置换关系。通过将立方体对称群表示为SymmetricGroup[8]的子群,并使用GroupElements/Permute来列举所有这样的置换,使用Mathematica的SAT求解器找到质心分配,选择具有不同奇异值的点集,给出更多细节和完整代码,请参考此处。
问题:
一种有趣的2D截面是指穿过正3Dsimplex中心和另外两个点的平面,每个点都是某些非空顶点子集的质心。这由两个顶点子集定义。例如{{1},{1,2}}给出了一个由三个点定义的平面——四面体的中心、第一个顶点和第一个和第二个顶点的平均值。
一组有趣的截面是一组没有两个截面在在重新标记顶点后定义相同平面的截面。例如,集合{{{1},{2}},{{3},{4}}}就不是有趣的。是否有一种有效的方法来找到一组有趣的截面?我需要一些可以推广到7D simplex的3D截面类似问题的方法,并且能在一晚上完成。
我尝试的方法如下。一个问题是如果忽略几何,一些等价的截面将被保留,因此我得到了10个截面而不是3个。更大的问题是我使用了蛮力算法,它绝对不能扩展 (对于7D simplex需要进行10^17个比较)。
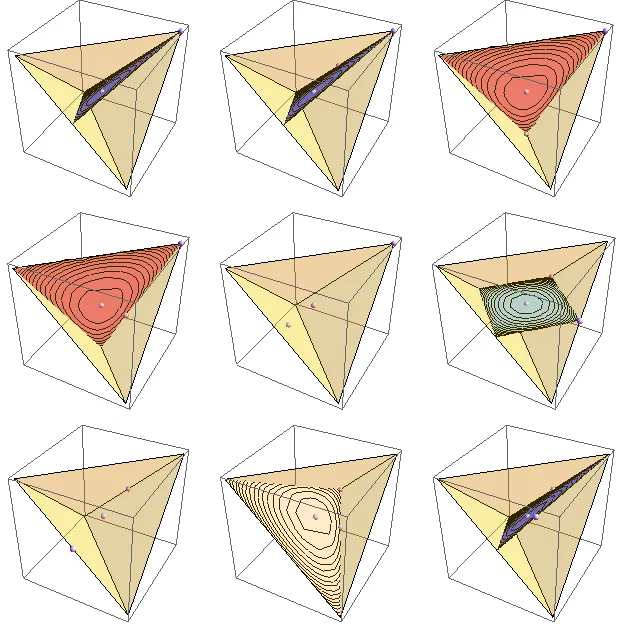
(来源:yaroslavvb.com)
这里是生成上图的Mathematica代码。
entropy[vec_] := Total[Table[p Log[p], {p, vec}]];
hadamard = KroneckerProduct @@ Table[{{1, 1}, {1, -1}}, {2}];
(* rows of hadamard matrix give simplex vertex coordinates *)

vertices = hadamard;
invHad = Inverse[hadamard];
m = {m1, m2, m3, m4};
vs = Range[4];

(* take a set of vertex averages, generate all combinations arising \
from labeling of vertices *)
vertexPermutations[set_] := (
   newSets = set /. Thread[vs -> #] & /@ Permutations[vs];
   Map[Sort, newSets, {2}]
   );
(* anchors used to define a section plane *)

sectionAnchors = Subsets[{1, 2, 3, 4}, {1, 3}];
(* all sets of anchor combinations with centroid anchor always \
included *)
anchorSets = Subsets[sectionAnchors, {2}];
anchorSets = Prepend[#, {1, 2, 3, 4}] & /@ anchorSets;
anchorSets = Map[Sort, anchorSets, {2}];
setEquivalent[set1_, set2_] := MemberQ[vertexPermutations[set1], set2];
equivalenceMatrix =
  Table[Boole[setEquivalent[set1, set2]], {set1, anchorSets}, {set2,
    anchorSets}];
Needs["GraphUtilities`"];
(* Representatives of "vertex-relabeling" equivalence classes of \
ancher sets *)
reps = First /@ StrongComponents[equivalenceMatrix];

average[verts_] := Total[vertices[[#]] & /@ verts]/Length[verts];
makeSection2D[vars_, {p0_, p1_, p2_}] := Module[{},
   v1 = p1 - p0 // Normalize;
   v2 = p2 - p0;
   v2 = v2 - (v1.v2) v1 // Normalize;
   Thread[vars -> (p0 + v1 x + v2 y)]
   ];

plotSection2D[f_, pointset_] := (
   simplex =
    Graphics3D[{Yellow, Opacity[.2],
      GraphicsComplex[Transpose@Rest@hadamard,
       Polygon[Subsets[{1, 2, 3, 4}, {3}]]]}];
   anchors = average /@ pointset;
   section = makeSection2D[m, anchors];
   rf = Function @@ ({{x, y, z, u, v},
       And @@ Thread[invHad.{1, x, y, z} > 0]});
   mf = Function @@ {{p1, p2, p3, x, y}, f[invHad.m /. section]};
   sectionPlot =
    ParametricPlot3D @@ {Rest[m] /. section, {x, -3, 3}, {y, -3, 3},
      RegionFunction -> rf, MeshFunctions -> {mf}};
   anchorPlot = Graphics3D[Sphere[Rest[#], .05] & /@ anchors];
   Show[simplex, sectionPlot, anchorPlot]
   );
plots = Table[
   plotSection2D[entropy, anchorSets[[rep]]], {rep, reps}];
GraphicsGrid[Partition[plots, 3]]