使用matlab从ECG信号中去除噪音的最佳滤波器是什么?
MATLAB:滤波噪声 EKG 信号
7
- kristia
5
“heart.wav”是什么?那是心电图吗? - gnovice
是的,我想分析心音。 - kristia
如果你所说的“心音”是指心电图信号,那么你应该重新表述问题。 - Amro
是的,我想知道哪种滤波器最适合用于从心脏信号中去除噪音。我拥有的信号是一个.wav文件。我想创建一个滤波器函数,并将信号文件插入其中,以便从该文件中去除噪音并显示和保存新信号。 - kristia
我刚刚更新了我的回答,并提供了许多过滤信号的方法。 - Amro
2个回答
16
如果您可以访问 信号处理工具箱,那么请查看Savitzky-Golay滤波器,特别是函数
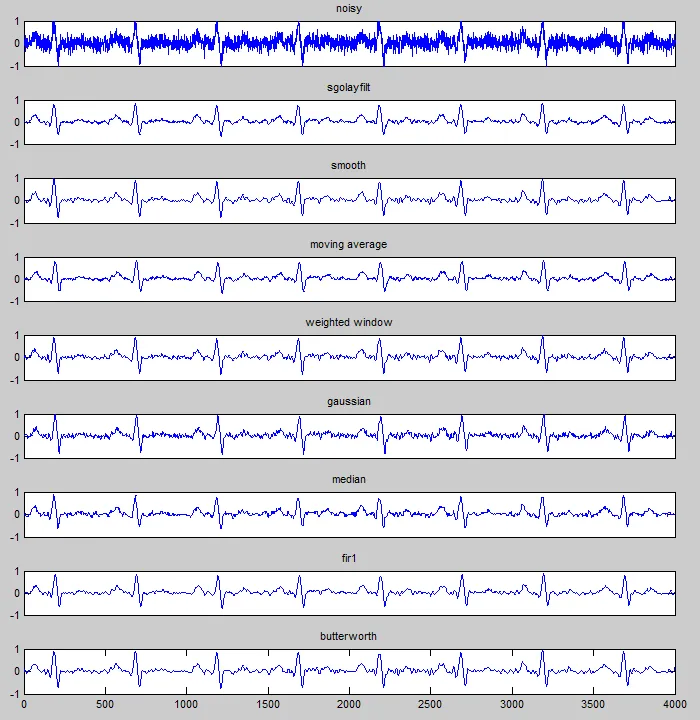
以下是一个示例,展示了您可以对信号应用滤波和去噪的各种方法。请注意,其中一些函数需要特定的工具箱存在:
sgolay。有一个配套的演示,只需运行sgolaydemo。
以下是一个示例,展示了您可以对信号应用滤波和去噪的各种方法。请注意,其中一些函数需要特定的工具箱存在:
% load ecg: simulate noisy ECG
Fs=500;
x = repmat(ecg(Fs), 1, 8);
x = x + randn(1,length(x)).*0.18;

% plot noisy signal
figure
subplot(911), plot(x), set(gca, 'YLim', [-1 1], 'xtick',[])
title('noisy')

% sgolay filter
frame = 15;
degree = 0;
y = sgolayfilt(x, degree, frame);
subplot(912), plot(y), set(gca, 'YLim', [-1 1], 'xtick',[])
title('sgolayfilt')

% smooth
window = 30;
%y = smooth(x, window, 'moving');
%y = smooth(x, window/length(x), 'sgolay', 2);
y = smooth(x, window/length(x), 'rloess');
subplot(913), plot(y), set(gca, 'YLim', [-1 1], 'xtick',[])
title('smooth')

% moving average filter
window = 15;
h = ones(window,1)/window;
y = filter(h, 1, x);
subplot(914), plot(y), set(gca, 'YLim', [-1 1], 'xtick',[])
title('moving average')

% moving weighted window
window = 7;
h = gausswin(2*window+1)./window;
y = zeros(size(x));
for i=1:length(x)
    for j=-window:window;
        if j>-i && j<(length(x)-i+1)
            %y(i) = y(i) + x(i+j) * (1-(j/window)^2)/window;
            y(i) = y(i) + x(i+j) * h(j+window+1);
        end
    end
end
subplot(915), plot( y ), set(gca, 'YLim', [-1 1], 'xtick',[])
title('weighted window')

% gaussian
window = 7;
h = normpdf( -window:window, 0, fix((2*window+1)/6) );
y = filter(h, 1, x);
subplot(916), plot( y ), set(gca, 'YLim', [-1 1], 'xtick',[])
title('gaussian')

% median filter
window = 15;
y = medfilt1(x, window);
subplot(917), plot(y), set(gca, 'YLim', [-1 1], 'xtick',[])
title('median')

% filter
order = 15;
h = fir1(order, 0.1, rectwin(order+1));
y = filter(h, 1, x);
subplot(918), plot( y ), set(gca, 'YLim', [-1 1], 'xtick',[])
title('fir1')

% lowpass Butterworth filter
fNorm = 25 / (Fs/2);               % normalized cutoff frequency
[b,a] = butter(10, fNorm, 'low');  % 10th order filter
y = filtfilt(b, a, x);
subplot(919), plot(y), set(gca, 'YLim', [-1 1])
title('butterworth')
- Amro
5
2我知道这是一个旧答案,但请记住,表面心电图的诊断准确性需要保留非常特定的频率范围。具体来说,0.05-1Hz应该保留用于最高保真度的ST段,而在ECG的其余部分中,成人应该使用40Hz的低通滤波器,儿科应该使用150Hz的低通滤波器(同时建议使用适当的陷波滤波器以过滤线频)。我对Savitzky-Golay FIR不太熟悉,但应注意确保它保留ECG中的重要频率。 - user7116
1+1 谢谢您提供的信息。我应该指出,我对心电图信号领域知识不是很了解,上面的答案只是从纯信号处理的角度(通过列举各种可用于一般信号滤波的函数)给出的。事实上,我对S-G滤波也不是很熟悉,之所以提到它,是因为我经常在与心电图相关的文献中看到它:http://www.uap-bd.edu/jcit_papers/vol-1_no-2/IJCIT-110126.pdf - Amro
整洁的论文,感谢您提供的参考!在考虑滤波器时,ECG结果的形态比较是最重要的因素。然而,对于简单的步态监测(许多人称之为“节律解释”),您可以在滤波器选择方面具有广泛的自由度,因为您可以接受一些信号失真。 - user7116
我的ECG经验仅限于提取RR间隔和使用Poincaré图以及其他HRV特征作为数据挖掘/机器学习应用的输入。 - Amro
这是最好的答案!此外,我可以像这样绘制我的CSV单位:veri= 'C:\ADS00003.CSV';
delimiter = ',';
HEADERLINES = 15;
yeniveri = importdata(veri, delimiter, HEADERLINES);
EKG=yeniveri.data;
B=(1/200)*ones(1,200);
A=1;
x=filter(B,A,EKG); - Bay
2
以下是两个与滤波器设计有关的工具/演示,您可能希望查看:
模拟滤波器设计工具箱,由James Squire在MathWorks文件交换上发布。该工具箱似乎包含了用于过滤EKG数据的模拟。
这些工具可以让您尝试不同的滤波器和滤波器参数,以查看它们在EKG / ECG数据上的表现。
- gnovice
1
在选择滤波器时,通常需要高通滤波器不大于0.05Hz,以确保心电图ST段的诊断使用具有高保真度。成人使用低通滤波器约为40Hz,小儿为150Hz,如果您想看到起搏器脉冲,则最好可用150-200Hz。 - user7116
网页内容由stack overflow 提供, 点击上面的可以查看英文原文,
原文链接
原文链接