Gnuplot 中的绘图:
例如,如果尝试在一个命令中设置数据点类型和误差线,则会出现“with”参数的冲突,即:
plot "test.csv" using 1:2:3 with points pointtype 5 with yerrorbars
错误信息如下:在绘图选项中重复或矛盾的参数。
有什么建议吗?
应该将其拆分为两个单独的命令吗?
还是真的有一种方法可以在一个命令中给出多个“with”参数?
例如,如果尝试在一个命令中设置数据点类型和误差线,则会出现“with”参数的冲突,即:
plot "test.csv" using 1:2:3 with points pointtype 5 with yerrorbars
错误信息如下:在绘图选项中重复或矛盾的参数。
有什么建议吗?
应该将其拆分为两个单独的命令吗?
还是真的有一种方法可以在一个命令中给出多个“with”参数?
不可以在同一行使用两个with参数。
但在您的情况下,这并不是必要的,因为yerrorbars样式也会绘制数据点:
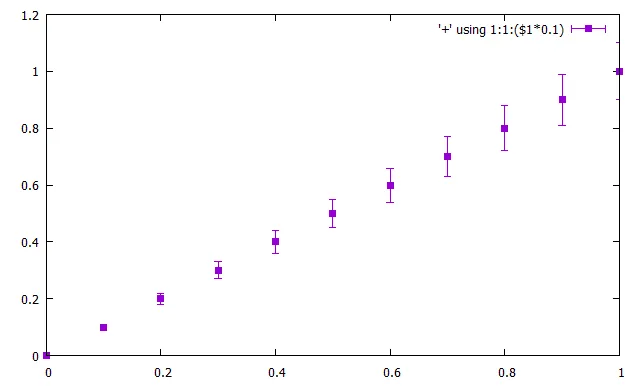
set xrange [0:1]
set samples 11
plot '+' using 1:1:($1*0.1) with yerrorbars pt 5
一般来说,您可以通过在单个plot命令中添加更多部分来组合不同的绘图样式,例如:
plot "file.dat" using 1:2 with lines, "" using 1:2:3 with yerrorbars
plot "file.dat" using 1:2 with lines, "" using 1:2:3 with labels。 - Christophfor循环中如何使用多个withs吗? 例如,plot for[i=3:6] "file.data" using 1:i with lines, "" using 1:i:i with labels。 - Ustaman Sangatplot for[i=3:6] "file.data" using 1:i with lines, for[i=3:6] "" using 1:i:i with labels。 - Ustaman Sangat