一个
numpy 视图。不如
clip 那么优雅。
选项1
df.assign(c=np.minimum(np.maximum(df.b.values, 0), 100))
  a  b   c
0 10 90  90
1 20 150 100
2 30 -30 0
选项2
b = df.b.values
df.assign(c=np.where(b > 100, 100, np.where(b < 0, 0, b)))

    a    b    c
0  10   90   90
1  20  150  100
2  30  -30    0
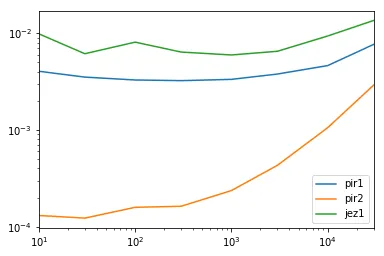
时间
以下是代码
res.div(res.min(1), 0)

            pir1  pir2       jez1
10     30.895514   1.0  75.210427
30     28.611177   1.0  49.913498
100    20.658307   1.0  50.823106
300    19.842134   1.0  39.162901
1000   14.078159   1.0  25.148937
3000    8.767133   1.0  15.066847
10000   4.377849   1.0   8.849138
30000   2.634263   1.0   4.653956
res = pd.DataFrame(
    index=[10, 30, 100, 300, 1000, 3000, 10000, 30000],
    columns=['pir1', 'pir2', 'jez1'],
    dtype=float
)

jez1 = lambda d: d.assign(c=df.b.clip(0, 1))
pir1 = lambda d: d.assign(c=np.minimum(np.maximum(d.b.values, 0), 100))
pir2 = lambda d: (lambda b: np.where(b > 100, 100, np.where(b < 0, 0, b)))(d.b.values)

for i in res.index:
    d = pd.concat([df] * i, ignore_index=True)
    for j in res.columns:
        stmt = '{}(d)'.format(j)
        setp = 'from __main__ import d, {}'.format(j)
        res.at[i, j] = timeit(stmt, setp, number=10)

res.plot(loglog=True)
df.max(axis=1)- MaxU - stand with Ukraine