这应该能解决问题:
import numpy as np
import matplotlib.pyplot as plt
def old_graph(A):
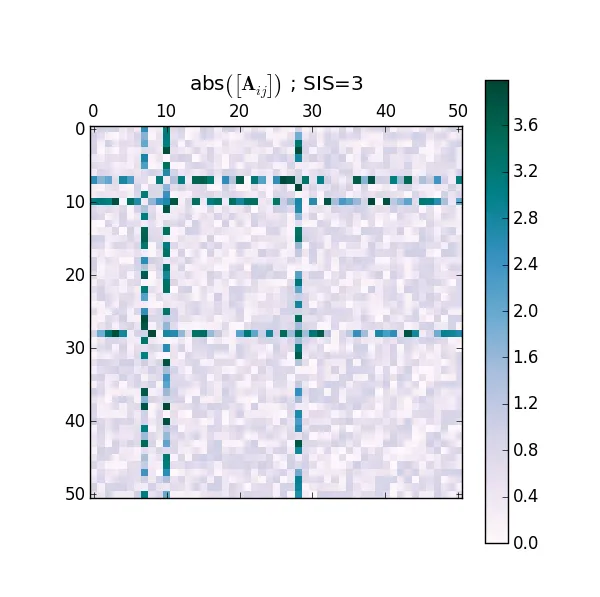
plt.matshow(A,cmap='PuBuGn')
plt.colorbar()
plt.title(r"abs$\left(\left[\mathbf{A}_{ij} \right ] \right )$ ; SIS=%d"%(sis,), va='bottom')
plt.show()
def new_graph(A, sis_list=np.zeros(0,int), symmetric=True, fig=None, pos=111):
if fig is None:
fig = plt.figure()
ax = fig.add_subplot(pos, projection='polar')
ax.set_rgrids([1],[' '])
ax.set_rmax(1)
ax.set_thetagrids([])
ax.set_title(r"abs$\left(\left[\mathbf{A}_{ij} \right ] \right )$ ; SIS=%d"%(sis,), va='bottom')
colormap = plt.get_cmap('PuBuGn')
n_species = A.shape[0]
angles = np.linspace(0, 2*np.pi, n_species+1)
r = np.ones((2,))
unordered_pairs_and_values = []
for index_line in xrange(n_species):
for index_column in xrange(index_line):
if symmetric:
value = A[index_line,index_column]
else:
value= abs(A[index_line,index_column]- A[index_column,index_line])
unordered_pairs_and_values.append([[angles[index_line],angles[index_column]], value])
ordered_pairs_and_values = sorted(unordered_pairs_and_values, key=lambda pair: pair[1])
I_max = ordered_pairs_and_values[-1][1]
for pair in ordered_pairs_and_values:
ax.plot(pair[0], r, color=colormap(pair[1]/I_max), linewidth=2, alpha=0.8)
ax.plot(angles, np.ones(angles.shape), 'ko')
ax.plot(angles[sis_list], np.ones(sis_list.shape), 'ro')
fig.show()
if __name__ == '__main__':
n_species = 51
sis = 3
sis_factor = 4.
A = np.zeros((n_species,n_species))
for index_line in xrange(n_species):
for index_column in xrange(index_line+1):
A[index_line,index_column] = np.random.random()
A[index_column,index_line] = A[index_line,index_column]
sis_list = np.random.randint(0,n_species,sis)
for species in sis_list:
A[species,:] *= sis_factor
A[:,species] *= sis_factor
for species2 in sis_list:
A[species,species2] /= sis_factor
old_graph(A=A)
new_graph(A=A, sis_list=sis_list, symmetric=True)
旧图:
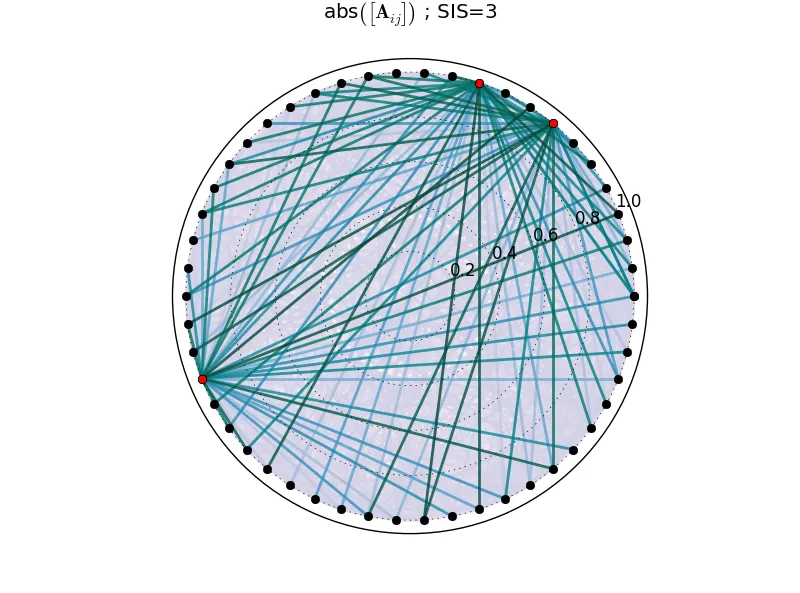
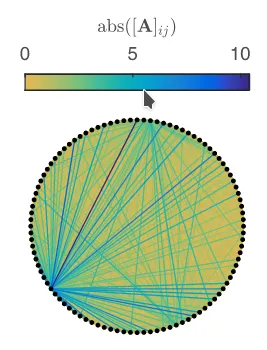
新图:
 我仍然不知道:
- 如何添加颜色条,因为它需要使用了一种颜色映射的绘图。
- 如何在不改变图形比例的情况下删除极轴刻度(您可以尝试取消注释
#ax.set_rticks([]))。
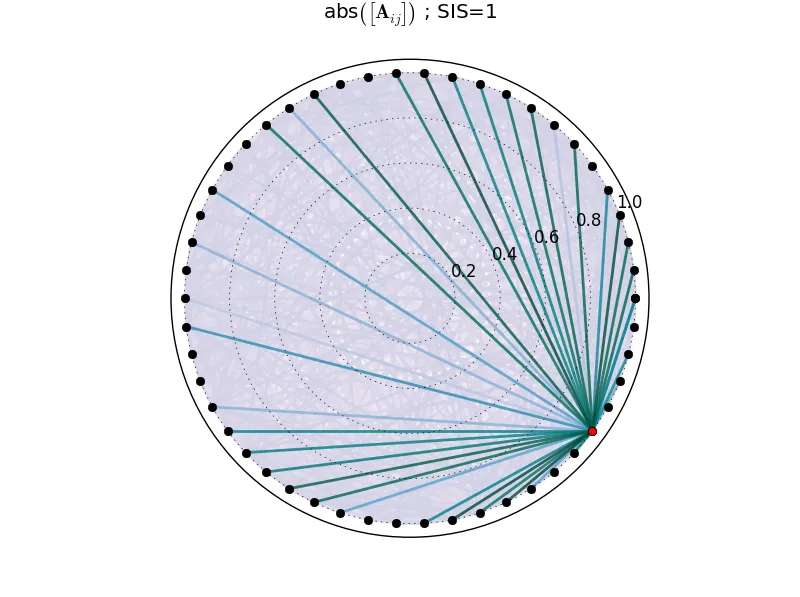
去除互动物种后,图像看起来更好:
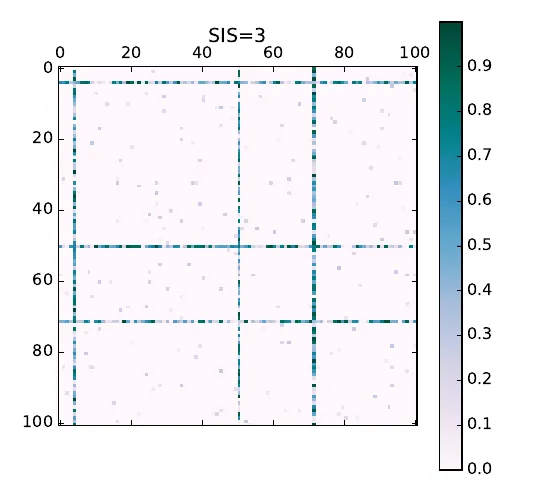 你应该将其视为物种之间的交互矩阵,正如你所看到的只有三个物种相互作用强烈。这就是为什么要考虑像我在论文中发现的以下图形一样的可视化方式,但我不知道这是否可以在Python中实现:
A[i,j]应该等于A[j,i])。否则,我就不知道要使用哪个值来给两种物种之间的线着色。 - berna1111A在论文中并不对称,但我想作者们也只考虑了其中一半,否则就没有构建你所正确陈述的图表的方法。 - Zdenko HeyvaertA[i][j]-A[j][i]定义,这将允许使用整个矩阵并证明使用abs的合理性,因为差值可能是负数。我会在答案中进行编辑。 - berna1111