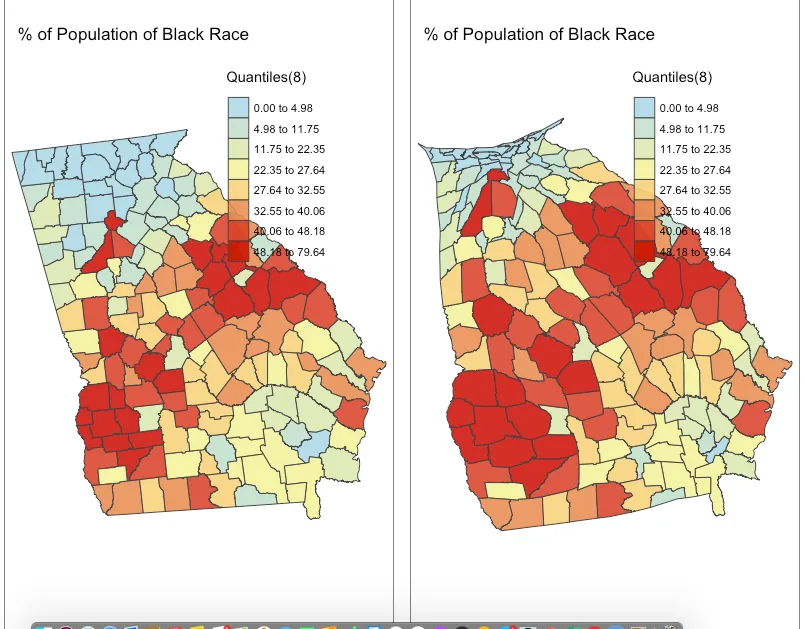
我是编程新手,目前正在学习使用R进行空间分析的入门课程。以下代码生成了下面的tmaps。如何使每个tmap的标题居中,并将图例放在右上角而不覆盖地图本身?
非常感谢您的帮助。
非常感谢您的帮助。
  ga1 = tm_shape(a2georgia) +
  tm_polygons('PctBlack', style='quantile', breaks=c(4.98,11.75, 22.35,27.64, 32.55, 40.06,   48.18, 79.64),
              n=8, palette=c('lightblue','khaki1', 'red3'), title='Quantiles(8)',
              border.col='grey27', alpha=.9) +
  tm_layout(legend.position = c("right", "top"), title= '% of Population of Black Race', title.position = c('right', 'top'))


ga_cartogram <- cartogram_cont(a2georgia, "PctBlack", itermax=5)

  ga2 = tm_shape(ga_cartogram) +
  tm_polygons("PctBlack", style='quantile', breaks=c(4.98,11.75, 22.35,27.64, 32.55, 40.06, 48.18, 79.64),
              n=8, palette=c('lightblue','khaki1', 'red3'), title='Quantiles(8)',
              border.col='grey27', alpha=.9) +
  tm_layout(legend.position = c("right", "top"), title= '% of Population of Black Race',  title.position = c('right', 'top'))


tmap_arrange(ga1,ga2)
main.title.position,可能的值是center。你看过吗? - Roman Luštrik