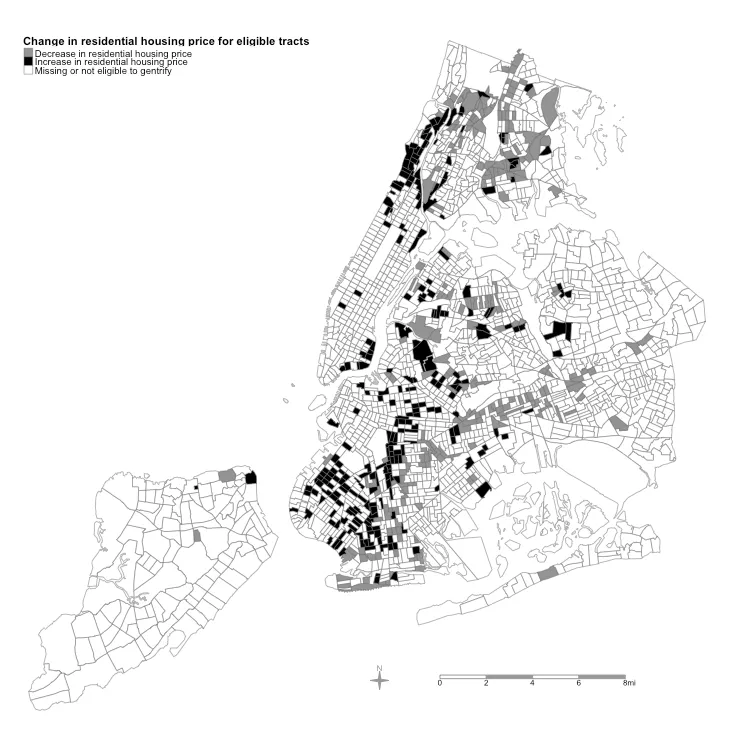
我希望能够操作图例中的“缺失”标签。
我在使用R中的tmap函数。我希望将其更改为“缺失或不符合升级条件”。
我尝试使用tm_text函数并考虑如何更改底层数据中的标签,但没有找到解决方案。此外,请注意代码使用映射功能。
我在使用R中的tmap函数。我希望将其更改为“缺失或不符合升级条件”。
我尝试使用tm_text函数并考虑如何更改底层数据中的标签,但没有找到解决方案。此外,请注意代码使用映射功能。
########################
# categorical mapping function
########################

cat.maps.wide.function <- function(data, varname, ltitle, colorplaette){
  tm_shape(data, unit = "mi") +
    tm_polygons(col = varname , # add variable(s)
                style = "cat", # set break pattern to object LQ.cuts
                palette = colorplaette,  # set color fill to blue refreshing
                border.col = "grey40", # color the borders white
                border.alpha = 0.5, # set border transparency
                title = ltitle, # title for legend
                colorNA = "white") + # color of missing data
    tm_style("bw") +
    tm_layout(panel.label.bg.color ="NA",
              frame = FALSE,
              bg.color = "transparent") + # panel label color
    tm_legend(legend.title.fontface = 2,  # legend bold
              legend.title.size = 0.75,
              legend.text.size = 0.65,
              legend.bg.alpha = 0,
              legend.width = 5) +
    tm_scale_bar(color.dark = "gray60", # Customize scale bar and north arrow
                 position = c(0.6, 0.05)) +  # set position of the scale bar
    tm_compass(type = "4star",
               size = 2.5, # set size of the compass
               fontsize = 0.5, # set font size of the compass
               color.dark = "gray60", # color the compass
               text.color = "gray60", # color the text of the compass
               position = c(0.5, 0.05)) +  # set position of the compass

    # add border names
    tm_shape(boro.boundaries) +
    tm_borders(alpha = .5) +
    tm_text("boro",
            size = 0.75,
            remove.overlap = TRUE,
            auto.placement=FALSE,
            xmod= "x", ymod= "y")

}

########################
# change in residential housing price
########################

# object for 2016 variable
mt1pva5.2016 <- cat.maps.wide.function(
  data = data.map.tract.wide,
  varname = "chgpcmt1pva5_overlap2016",
  colorplaette = mt1pva5.overlap.colors,
  ltitle = "Change in residential housing price for eligible tracts ")

mt1pva5.2016