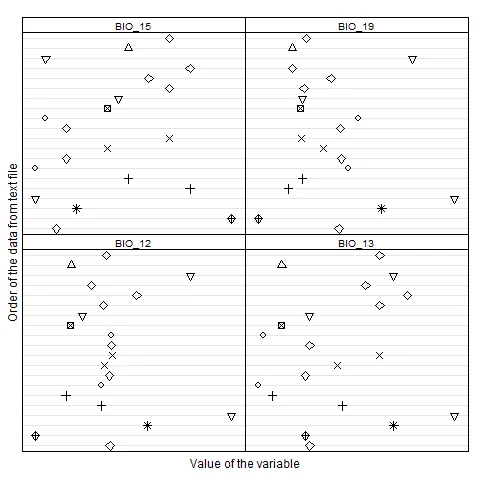
我有一个包含位置(坐标)和环境数据的数据集,并且我想为数据集中的每个环境变量创建点图(请参见下面的样本数据和代码)。与每个点图中所有点都使用单一符号(例如pch=16)不同,我想使用由一度纬线决定的独特符号,例如abs(latitude)。
我的R样本数据集:
我的R样本数据集:
WW_Covs <- structure(list(Latitude = c(62.4419, 67.833333, 65.95, 63.72935,
60.966667, 60.266667, 55.660455, 62.216667, 61.3, 61.4, 62.084139, 55.662566,
64.48508, 63.208354, 62.87591, 62.70856, 62.64009, 63.79488, 59.55, 62.84206), BIO_02
= c(87, 82, 75, 70, 77, 70, 59, 84, 84, 79, 85, 60, 91, 87, 74, 74, 76, 70, 76, 74),
BIO_03 = c(26, 23, 25, 26, 25, 24, 25, 25, 26, 25, 26, 26, 24, 25, 24, 25, 25, 25, 26,
24), BIO_04 = c(8443, 9219, 7594, 6939, 7928, 7593, 6160, 8317, 8167, 7972, 8323,
6170, 9489, 8578, 7814, 7680, 7904, 7149, 7445, 7803), BIO_05 = c(201, 169, 151, 166,
194, 210, 202, 205, 204, 186, 205, 200, 200, 195, 170, 154, 180, 166, 219, 170),
BIO_06 = c(-131, -183, -144, -102, -107, -75, -26, -119, -113, -120, -120, -28, -169,
-143, -131, -142, -124, -111, -72, -129), BIO_08 = c(128, 109, 85, 78, 122, 145, 153,
134, 130, 126, 132, 152, 120, 119, 115, 98, 124, 104, 147, 115), BIO_09 = c(-31, -81,
-16, 13, -60, -6, 25, -25, -25, -70, -25, 23, -56, -39, -47, -60, -39, 8, 0, -46),
BIO_12 = c(667, 481, 760, 970, 645, 557, 645, 666, 652, 674, 670, 670, 568, 598, 650,
734, 620, 868, 571, 658), BIO_13 = c(78, 77, 96, 109, 85, 70, 67, 77, 84, 93, 78, 68,
72, 78, 93, 99, 90, 96, 72, 93), BIO_15 = c(23, 40, 25, 21, 36, 30, 21, 24, 28, 34,
24, 22, 28, 29, 34, 32, 36, 22, 30, 34), BIO_19 = c(147, 85, 180, 236, 108, 119, 154,
149, 135, 118, 148, 162, 117, 119, 120, 141, 111, 204, 111, 122)), .Names =
c("Latitude", "BIO_02", "BIO_03", "BIO_04", "BIO_05", "BIO_06", "BIO_08", "BIO_09",
"BIO_12", "BIO_13", "BIO_15", "BIO_19"), row.names = c(1:20), class = "data.frame")
我的R点图代码:
library(lattice)
dotplot(as.matrix(WW_Covs[,-c(1:8)]), groups = FALSE,
            strip = strip.custom(bg = 'white', par.strip.text = list(cex = 0.8)),
            scales = list(x = list(relation = "free"), y = list(relation = "free"),
            draw = FALSE), col = 1, cex  = 0.5, pch = 16, xlab = "Value of the variable",
            ylab = "Order of the data from text file")
Error in dotplot(as.matrix(en[, -c(1:8)]), groups = FALSE, strip = strip.custom(bg = "white", : argument 6 matches multiple formal arguments。 - Paul Hiemstraepicalc)。只要加载lattice就可以了...我已经编辑了问题。 - Paul Hiemstra