我是这个社区的新成员,我在尝试多次搜索在线提供的解决方案后才发布了这篇文章。但是,我仍然无法解决它。
以下代码
dat<-read.csv("Harvard tutorial/Rgraphics/dataSets/EconomistData.csv")
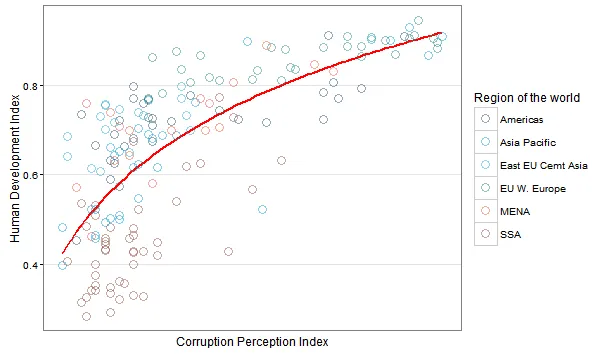
g <- ggplot(dat, aes(dat$CPI, dat$HDI))
g1 <- g + theme_bw() + geom_smooth(method = "lm", formula = y ~log(x), se = FALSE, color = "Red", linetype = 1, weight = 3) +
geom_point(aes(color = Region), size = 4, fill = 4, alpha = 1/2, shape = 1) +
scale_x_continuous(name = "Corruption Perception Index", breaks = NULL) +
scale_y_continuous(name = "Human Development Index") +
scale_color_manual(name = "Region of the world", values = c("#24576D", "#099DD7", "#28AADC", "#248E84", "#F2583F", "#96503F")) +
theme(axis.text.x = element_text(angle = 90, size = 15))
这给我以下结果:
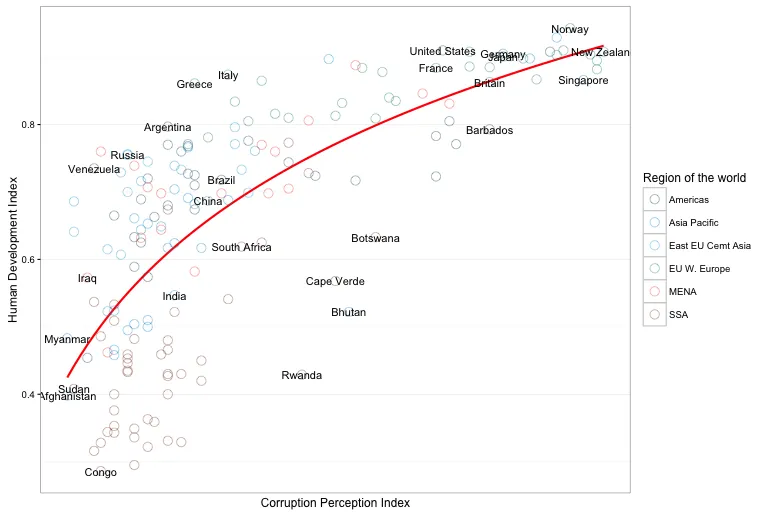
pointsToLabel <- c("Russia", "Venezuela", "Iraq", "Myanmar", "Sudan",
                   "Afghanistan", "Congo", "Greece", "Argentina", "Brazil",
                   "India", "Italy", "China", "South Africa", "Spane",
                   "Botswana", "Cape Verde", "Bhutan", "Rwanda", "France",
                   "United States", "Germany", "Britain", "Barbados", "Norway", "Japan",
                   "New Zealand", "Singapore")

g2 <- g1 + geom_text(aes(dat$CPI, dat$HDI, label = dat$Country), data = subset(x = dat,subset =  Country %in% pointsToLabel))
我遇到了以下错误:
错误:美学属性必须是长度为1或与数据相同(27):x、y、label。
有人可以帮我解决这个问题吗?
该数据来源于哈佛GGPLOT2教程:http://tutorials.iq.harvard.edu/R/Rgraphics.zip 供您参考,该数据集的结构如下:
'data.frame':   173 obs. of  6 variables:
 $ X       : int  1 2 3 4 5 6 7 8 9 10 ...
 $ Country : Factor w/ 173 levels "Afghanistan",..: 1 2 3 4 5 6 7 8 9 10 ...
 $ HDI.Rank: int  172 70 96 148 45 86 2 19 91 53 ...
 $ HDI     : num  0.398 0.739 0.698 0.486 0.797 0.716 0.929 0.885 0.7 0.771 ...
 $ CPI     : num  1.5 3.1 2.9 2 3 2.6 8.8 7.8 2.4 7.3 ...
 $ Region  : Factor w/ 6 levels "Americas","Asia Pacific",..: 2 3 5 6 1 3 2 4 3 1 ...
aes内使用data$column。相反,只需使用列名,因为您已经指示要在ggplot(data = dat)中使用哪些数据。其次,您可以在“dat”中创建一个带有您的“pointsToLabel”向量的列(非标记点为空白或NA),然后将该列指定为传递给ggplot的标签。 - oshun