我需要使用ggplot的fortify功能,但在使用Open Streetmap地图文件时,fortify会丢失一些线条的顺序。文件中的顺序必须是正确的,因为qgis和sp包在绘制图表时没有问题。
这里是一个德国城镇道路的示例:
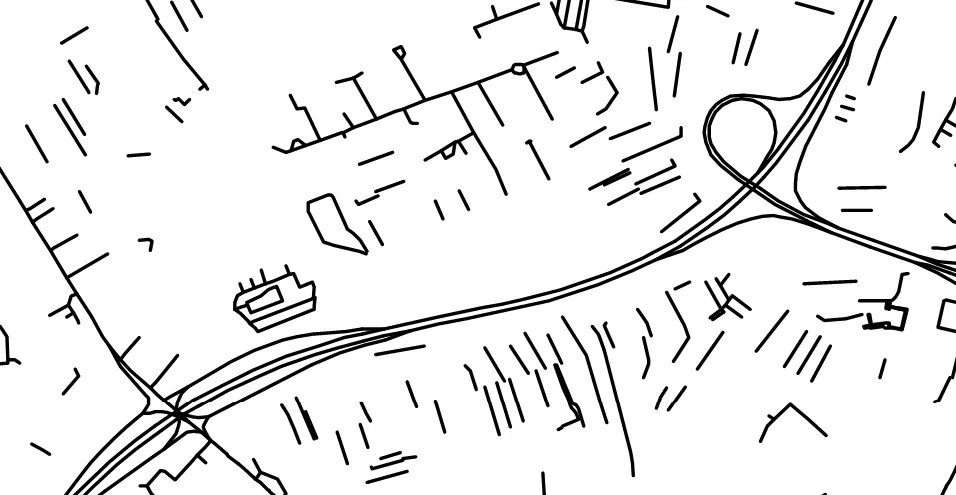
Qgis:

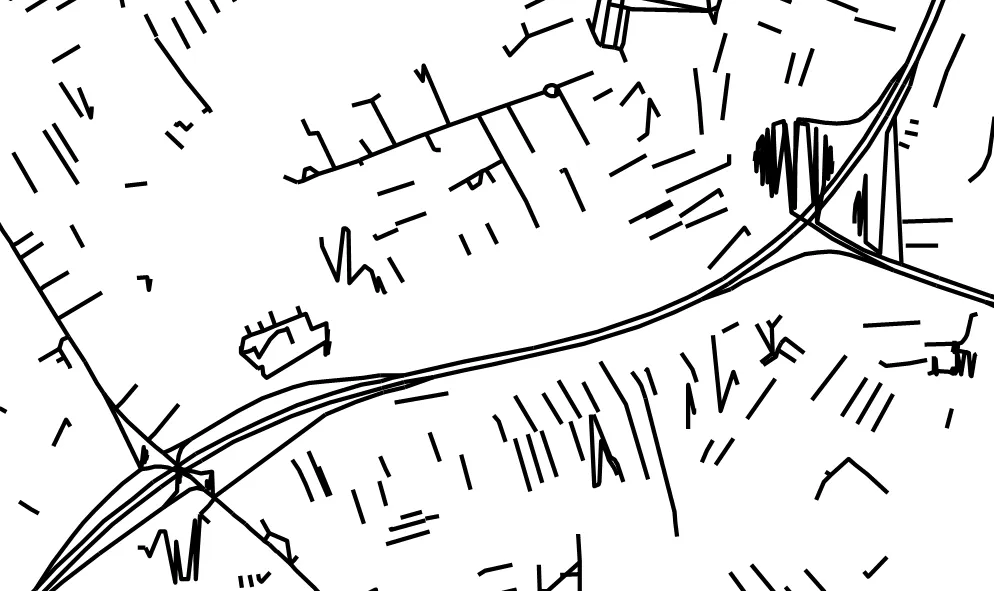
在 sp 中看起来不错:
这是一个关于高速公路部分的小例子
(数据在这里)
library(ggplot)
library(sp)
plot(sample_shape)
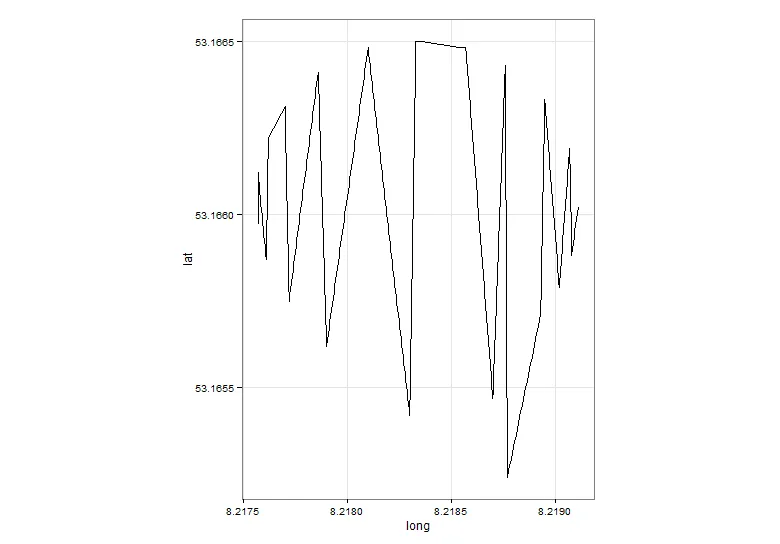
ggplot(data = fortify(sample_shape), aes(x = long, y = lat, group = group), size = 0.05) + geom_line() + theme_bw()
再次强调,sp 看起来很好,ggplot 不行:

非常感谢任何帮助或提示!
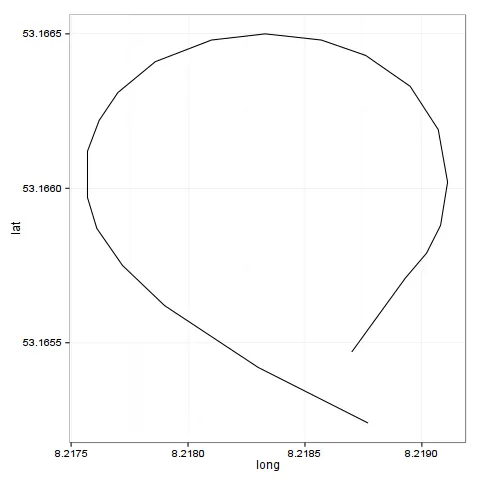
geom_path()对于道路来说更好,geom_polygon()则适用于行政边界。 - maccruiskeen