我有一个用以下命令绘制的图表:
ggplot(data=test_mod, aes(x=realDist , y=1-value, color=as.factor(foo) , size=as.factor(foo) )) +
  stat_summary(fun.y=mean, geom="line", alpha=0.85 ) +
  stat_summary(fun.y=mean, geom="point", pch=21, fill="white", size=2 ) +
  #stat_summary(fun.data=mean_cl_normal, geom="errorbar", width=8, size = 0.5) +
  theme_bw(base_size = 15, base_family = "Palatino") +
  theme(legend.key = element_blank())
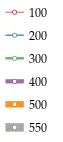
我得到了下面这个图例:
然而,当我取消注释命令的第三行时:
ggplot(data=test_mod, aes(x=realDist , y=1-value, color=as.factor(foo) , size=as.factor(foo) )) +
  stat_summary(fun.y=mean, geom="line", alpha=0.85 ) +
  stat_summary(fun.y=mean, geom="point", pch=21, fill="white", size=2 ) +
  stat_summary(fun.data=mean_cl_normal, geom="errorbar", width=8, size = 0.5) +
  theme_bw(base_size = 15, base_family = "Palatino") +
  theme(legend.key = element_blank())
我得到了一个略微不同的图例:
 请注意,当我在绘图中使用
errorbar时,在点之后会出现一些细小的线条。如何消除在我的图例中出现的这些细小的线条?
show_guide已被弃用,现在应该使用show.legend。 - Tunaki