我在尝试使用Altair Gallery中的以下示例进行操作:https://altair-viz.github.io/gallery/airports_count.html。目前,似乎唯一显示实际计数的方法是通过工具提示,就像示例所示。然而,我正在编写一个静态可视化,如果可以在标记旁边直接显示精确值而无需用户悬停或交互,那将非常有帮助。是否有一种方法可以实现这一点?
1个回答
1
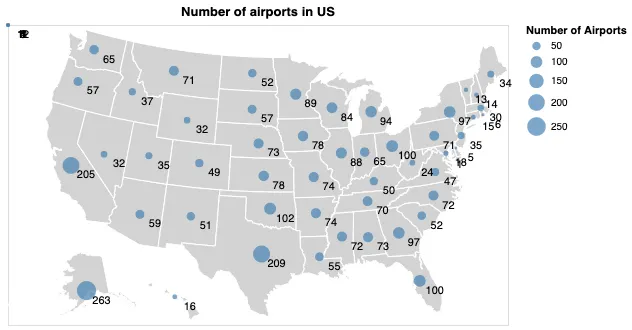
您可以手动计算文本标签的偏移量来实现这一点,但当点变得拥挤时,这确实很困难:
import altair as alt
from vega_datasets import data

airports = data.airports.url
states = alt.topo_feature(data.us_10m.url, feature='states')

# US states background
background = alt.Chart(states).mark_geoshape(
    fill='lightgray',
    stroke='white'
).properties(
    width=500,
    height=300
).project('albersUsa')

# airport positions on background
base = alt.Chart(airports).transform_aggregate(
    latitude='mean(latitude)',
    longitude='mean(longitude)',
    count='count()',
    groupby=['state']
).encode(
    longitude='longitude:Q',
    latitude='latitude:Q',
)

points = base.mark_circle().encode(
    size=alt.Size('count:Q', title='Number of Airports'),
    color=alt.value('steelblue'),
    tooltip=['state:N','count:Q']
).properties(
    title='Number of airports in US'
)

text = base.mark_text(
    dx=15, dy=10
).encode(
    text='count:Q'
)

background + points + text
- jakevdp
网页内容由stack overflow 提供, 点击上面的可以查看英文原文,
原文链接
原文链接