有没有一种方法可以在Altair标签中实现自动换行或插入换行符?

4
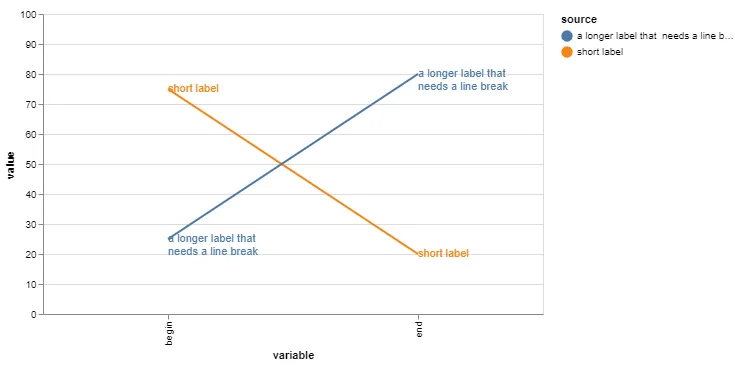
有没有办法在Altair中显示更长的标签时插入换行?
d = {'source': ['short label', 'a longer label that needs a line break', 'short label', 'a longer label that needs a line break'], 'variable': ['begin','begin','end','end'], 'value':[75, 25, 20, 80]}
df = pd.DataFrame(data=d)

slope = alt.Chart(df).mark_line().encode(x='variable:N',y=alt.Y('value:Q',scale=alt.Scale(domain=(0,100))),color='source')
text = slope.mark_text(align='left',baseline='middle').encode(text='source:N')
(slope + text).properties(width=200)`

我看到一个关于标题的选项中有一个数组列表,但我尝试使用它来设置标签时无效。


那么我猜这个问题没有解决方案了? - Luise
3个回答

5
对于这个特定的示例,您可以向需要换行的标签添加一个新行字符:'a longer label that \nneeds a line break',然后更改mark_text内的参数以包括lineBreak=r'\n'
d = {'source': ['short label', 'a longer label that \nneeds a line break', 'short label', 'a longer label that \nneeds a line break'], 'variable': ['begin','begin','end','end'], 'value':[75, 25, 20, 80]}
df = pd.DataFrame(data=d)

slope = alt.Chart(df).mark_line().encode(x='variable:N',y=alt.Y('value:Q',scale=alt.Scale(domain=(0,100))),color='source')
text = slope.mark_text(align='left',baseline='middle', lineBreak=r'\n').encode(text='source:N')
(slope + text).properties(width=500)

enter image description here


0

我在使用lineBreak时遇到了问题...但正如https://github.com/altair-viz/altair/issues/2376中指出的那样,您也可以只传递一个字符串列表,它们将被打印在单独的行上。

(这是我永远无法挽回的一小时 :P - 希望这个评论能帮助其他人)


0

我能够找到一个适合我的目的的解决方法。我调整了数据框以将较长的标签分成两部分,并使用dx/dy调整将它们移动到正确的位置。

d = {'source1': ['short label', 'a longer label that', 'short label', 'a longer label that']
,'source2': ['', 'needs a line break', '', 'needs a line break']
,'variable': ['begin','begin','end','end']
,'value':[75, 25, 20, 80]}

df = pd.DataFrame(data=d)

print(df)

               source1             source2 variable  value
0          short label                        begin     75
1  a longer label that  needs a line break    begin     25
2          short label                          end     20
3  a longer label that  needs a line break      end     80


slope = alt.Chart(df).mark_line().encode(x='variable:N',y=alt.Y('value:Q',scale=
        alt.Scale(domain=(0,100)),axis=alt.Axis(grid=False)),
        color=alt.Color('source1',legend=None))
text1 = slope.mark_text(align='left',baseline='middle', dx=10).encode(text='source1:N')
text2 = slope.mark_text(align='left',baseline='middle', dx=10, dy=10).encode(text='source2:N')

(slope + text1 + text2).properties(width=500)

Text


网页内容由stack overflow 提供, 点击上面的
可以查看英文原文,
原文链接