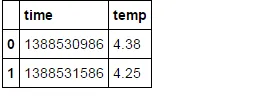
我试图从下面所示的JSON输出中创建一个DataFrame。
{
   "tags":[
      {
     "stats":{
        "rawCount":9
     },
     "name":"Temperature1",
     "results":[
        {
           "attributes":{
              "Location":[
                 "3rd Floor"
              ],
              "Sensor-Serial-Number":[
                 "PT100"
              ]
           },
           "values":[
              [
                 1460958592800,
                 24.2,
                 3
              ],
              [
                 1460958602800,
                 24.1,
                 1
              ],
              [
                 1460958612800,
                 23.9,
                 1
              ],
              [
                 1460958622800,
                 24.2,
                 1
              ],
              [
                 1460958632800,
                 24.5,
                 1
              ],
              [
                 1460958642800,
                 24.9,
                 1
              ],
              [
                 1460958652800,
                 24.6,
                 1
              ],
              [
                 1460958662800,
                 24.7,
                 1
              ],
              [
                 1460958672800,
                 24.7,
                 1
              ]
           ],
           "groups":[
              {
                 "type":"number",
                 "name":"type"
              }
           ]
        }
     ]
      }
   ]
}
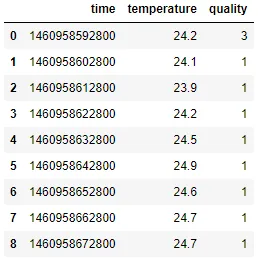
我只需要值,并且需要将其转换为下面图片中所示的DataFrame。