我正在使用Tkinter开发一个应用程序,使用matplotlib中的pyplot创建饼图。我已经成功地显示了没有图例的饼图,以显示百分比。以下是相关的源代码片段。
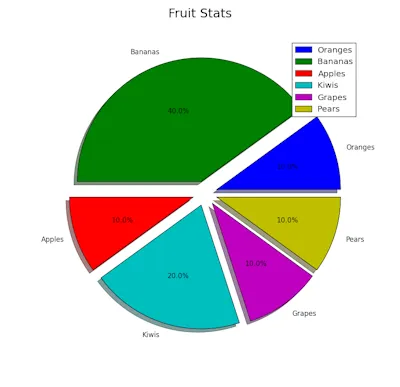
labels = ["Oranges", "Bananas", "Apples", "Kiwis", "Grapes", "Pears"]
values = [0.1, 0.4, 0.1, 0.2, 0.1, 0.1]

 # now to get the total number of failed in each section
actualFigure = plt.figure(figsize = (8,8))
actualFigure.suptitle("Fruit Stats", fontsize = 22)

#explode=(0, 0.05, 0, 0)
# as explode needs to contain numerical values for each "slice" of the pie chart (i.e. every group needs to have an associated explode value)
explode = list()
for k in labels:
    explode.append(0.1)

pie= plt.pie(values, labels=labels, explode = explode, shadow=True)

canvas = FigureCanvasTkAgg(actualFigure, self)
canvas.get_tk_widget().pack()
canvas.show()
我还能够显示相同的饼图,带有图例但没有数字值:
labels = ["Oranges", "Bananas", "Apples", "Kiwis", "Grapes", "Pears"]
values = [0.1, 0.4, 0.1, 0.2, 0.1, 0.1]

 # now to get the total number of failed in each section
actualFigure = plt.figure(figsize = (10,10))
actualFigure.suptitle("Fruit Stats", fontsize = 22)

#explode=(0, 0.05, 0, 0)
# as explode needs to contain numerical values for each "slice" of the pie chart (i.e. every group needs to have an associated explode value)
explode = list()
for k in labels:
    explode.append(0.1)

pie, text= plt.pie(values, labels=labels, explode = explode, shadow=True)
plt.legend(pie, labels, loc = "upper corner")

canvas = FigureCanvasTkAgg(actualFigure, self)
canvas.get_tk_widget().pack()
canvas.show()
然而,我无法同时在饼图上显示图例和数值。
如果我在饼图中添加"autopct='%1.1f%%'"字段,即在text = plt.pie(...)行中加入该字段,我会得到以下错误:
"pie,text = plt.pie(values,labels = labels,explode = explode,autopct ='%1.1f%',shadow = True) ValueError:要解包的值太多"