R:将因子列转换为多个布尔列。

23

我正在尝试将一个因子列转换为多个布尔列,如下图所示。数据来自气象站,使用精细的weatherData包检索。我想要将要转换为多个布尔列的因子列包含11个因子。其中一些是单个“事件”,而另一些是“事件”组合。
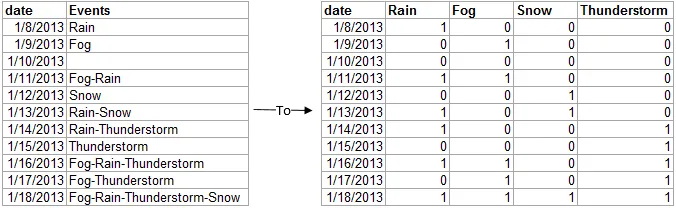
这里有一张图片展示了我想要实现的内容: enter image description here 这是生成我想要转换为多个布尔列的组合因子数据框的R代码:

df <- read.table(text="
date    Events
1/8/2013    Rain
1/9/2013    Fog
1/10/2013   ''
1/11/2013   Fog-Rain
1/12/2013   Snow
1/13/2013   Rain-Snow
1/14/2013   Rain-Thunderstorm
1/15/2013   Thunderstorm
1/16/2013   Fog-Rain-Thunderstorm
1/17/2013   Fog-Thunderstorm
1/18/2013   Fog-Rain-Thunderstorm-Snow",
                 header=T)
df$date <- as.character(as.Date(df$date, "%m/%d/%Y"))

提前致谢。

7个回答

13

您可以尝试:

 lst <- strsplit(as.character(df$Events),"-")
 lvl <- unique(unlist(lst))      
 res <- data.frame(date=df$date,
            do.call(rbind,lapply(lst, function(x) table(factor(x, levels=lvl)))), 
                                       stringsAsFactors=FALSE)

  res
 #         date Rain Fog Snow Thunderstorm
 #1  2013-01-08    1   0    0            0
 #2  2013-01-09    0   1    0            0
 #3  2013-01-10    0   0    0            0
 #4  2013-01-11    1   1    0            0
 #5  2013-01-12    0   0    1            0
 #6  2013-01-13    1   0    1            0
 #7  2013-01-14    1   0    0            1
 #8  2013-01-15    0   0    0            1
 #9  2013-01-16    1   1    0            1
 #10 2013-01-17    0   1    0            1
# 11 2013-01-18    1   1    1            1

或者,这可能比上面的更快(由@alexis_laz贡献)

  setNames(data.frame(df$date, do.call(rbind,lapply(lst, function(x) as.integer(lvl %in% x)) )), c("date", lvl))  

或者

 library(devtools)
 library(data.table)
 source_gist("11380733")
 library(reshape2) #In case it is needed 

 res1 <- dcast.data.table(cSplit(df, "Events", "-", "long"), date~Events)
 res2 <- merge(subset(df, select=1), res1, by="date", all=TRUE)
 res2 <- as.data.frame(res2)
 res2[,-1]  <- (!is.na(res2[,-1]))+0
 res2[,c(1,3,2,4,5)]
 #          date Rain Fog Snow Thunderstorm
  #1  2013-01-08    1   0    0            0
  #2  2013-01-09    0   1    0            0
  #3  2013-01-10    0   0    0            0
  #4  2013-01-11    1   1    0            0
  #5  2013-01-12    0   0    1            0
  #6  2013-01-13    1   0    1            0
  #7  2013-01-14    1   0    0            1
  #8  2013-01-15    0   0    0            1
  #9  2013-01-16    1   1    0            1
  #10 2013-01-17    0   1    0            1
  #11 2013-01-18    1   1    1            1

或者

 library(qdap)
 with(df, termco(Events, date, c("Rain", "Fog", "Snow", "Thunderstorm")))[[1]][,-2]
 #         date Rain Fog Snow Thunderstorm
 #1  2013-01-08    1   0    0            0
 #2  2013-01-09    0   1    0            0
 #3  2013-01-10    0   0    0            0
 #4  2013-01-11    1   1    0            0
 #5  2013-01-12    0   0    1            0
 #6  2013-01-13    1   0    1            0
 #7  2013-01-14    1   0    0            1
 #8  2013-01-15    0   0    0            1
 #9  2013-01-16    1   1    0            1
 #10 2013-01-17    0   1    0            1
 #11 2013-01-18    1   1    1            1

第二个例子需要使用reshape2来进行dcast操作。 - Spacedman
@Spacedman。谢谢。我以为只要加载了reshape2data.tabledcast就可以正常工作。看来dcast.data.table是不需要使用reshape2的。 - akrun
@David Arenburg。我尝试了一下不加载reshape2,它对于我来说能正常工作。 - akrun
@David Arenburg。我的是data.table_1.9.2 - akrun
是的,现在似乎默认加载它了,尽管在帮助文件中显示需要手动加载。可能是一些新功能或其他什么东西。 - David Arenburg
显示剩余13条评论

8

我能想到的最简单的方法是使用我的“splitstackshape”包中的concat.split.expanded函数(GitHub上的开发版本1.3.0)。

## Get the right version of the package
library(devtools)
install_github("splitstackshape", "mrdwab", ref = "devel")
packageVersion("splitstackshape")
# [1] ‘1.3.0’

## Split up the relevant column
concat.split.expanded(df, "Events", "-", type = "character", 
                      fill = 0, drop = TRUE)
#          date Events_Fog Events_Rain Events_Snow Events_Thunderstorm
# 1  2013-01-08          0           1           0                   0
# 2  2013-01-09          1           0           0                   0
# 3  2013-01-10          0           0           0                   0
# 4  2013-01-11          1           1           0                   0
# 5  2013-01-12          0           0           1                   0
# 6  2013-01-13          0           1           1                   0
# 7  2013-01-14          0           1           0                   1
# 8  2013-01-15          0           0           0                   1
# 9  2013-01-16          1           1           0                   1
# 10 2013-01-17          1           0           0                   1
# 11 2013-01-18          1           1           1                   1

回答这个问题时,我意识到我在concat.split.expanded中已经傻乎乎地硬编码了一个“trim”功能,可能会大大减慢速度。如果你想要一个更快的方法,可以直接在“Events”列的拆分版本上使用charMat(由concat.split.expanded调用的函数),像这样:

splitstackshape:::charMat(
    strsplit(as.character(indf[, "Events"]), "-", fixed = TRUE), fill = 0)

如果要进行一些基准测试,请查看这个Gist


4
这里介绍一种使用qdapTools的方法:
library(qdapTools)

matrix2df(mtabulate(lapply(split(as.character(df$Events), df$date), 
    function(x) strsplit(x, "-")[[1]])), "Date")

##          Date Fog Rain Snow Thunderstorm
## 1  2013-01-08   0    1    0            0
## 2  2013-01-09   1    0    0            0
## 3  2013-01-10   0    0    0            0
## 4  2013-01-11   1    1    0            0
## 5  2013-01-12   0    0    1            0
## 6  2013-01-13   0    1    1            0
## 7  2013-01-14   0    1    0            1
## 8  2013-01-15   0    0    0            1
## 9  2013-01-16   1    1    0            1
## 10 2013-01-17   1    0    0            1
## 11 2013-01-18   1    1    1            1

使用 magrittr,相同的答案可以使链条更加清晰:

split(as.character(df$Events), df$date) %>%
    lapply(function(x) strsplit(x, "-")[[1]]) %>%
    mtabulate() %>%
    matrix2df("Date")

4

可以使用基础的R语言中的'grep'函数来完成:

ddf = data.frame(df$date, df$Events, "Rain"=rep(0), "Fog"=rep(0), "Snow"=rep(0), "Thunderstorm"=rep(0)) 

for(i in 3:6)   ddf[grep(names(ddf)[i],ddf[,2]),i]=1

ddf
      df.date                  df.Events Rain Fog Snow Thunderstorm
1  2013-01-08                       Rain    1   0    0            0
2  2013-01-09                        Fog    0   1    0            0
3  2013-01-10                               0   0    0            0
4  2013-01-11                   Fog-Rain    1   1    0            0
5  2013-01-12                       Snow    0   0    1            0
6  2013-01-13                  Rain-Snow    1   0    1            0
7  2013-01-14          Rain-Thunderstorm    1   0    0            1
8  2013-01-15               Thunderstorm    0   0    0            1
9  2013-01-16      Fog-Rain-Thunderstorm    1   1    0            1
10 2013-01-17           Fog-Thunderstorm    0   1    0            1
11 2013-01-18 Fog-Rain-Thunderstorm-Snow    1   1    1            1

2
+1. 我正在更新我的基准测试,如果您预先知道期望的值,这是一个快速的解决方案(到目前为止最快的)。 - A5C1D2H2I1M1N2O1R2T1
我在这个答案的基础上进行了改进,动态识别唯一选项,因此您不需要提前知道值。 - Rumpleteaser

2
创建一个带有因子的向量
set.seed(1)
n <- c("Rain", "Fog", "Snow", "Thunderstorm")
v <- sapply(sample(0:3,100,T), function(i) paste0(sample(n,i), collapse = "-"))
v <- as.factor(v)

该函数返回一个矩阵,其中包含所需的输出,应将其与初始数据框 cbind

mSplit <- function(vec) {
  if (!is.character(vec))
    vec <- as.character(vec)
  L <- strsplit(vec, "-")
  ids <- unlist(lapply(seq_along(L), function(i) rep(i, length(L[[i]])) ))
  U <- sort(unique(unlist(L)))
  M <- matrix(0, nrow = length(vec), 
              ncol = length(U), 
              dimnames = list(NULL, U))
  M[cbind(ids, match(unlist(L), U))] <- 1L
  M
}

解决方案基于Ananda Mahto的回答,回答了这个SO问题。它应该非常快速。
res <- mSplit(v)

1
+1. 这基本上就是你在我回答中提到的“splitstackshape”库的charMat代码中会看到的内容。 - A5C1D2H2I1M1N2O1R2T1

2
在@rnso的回答基础上,以下代码将识别所有唯一元素,然后动态生成包含相关数据的新列。
options = unique(unlist(strsplit(df$Events, '-'), recursive=FALSE))
for(o in options){
  df$newcol = rep(0)
  df <- rename(df, !!o := newcol)
  df[grep(o, df$Events), o] = 1
}

结果:

         date                     Events Rain Fog Snow Thunderstorm
1  2013-01-08                       Rain    1   0    0            0
2  2013-01-09                        Fog    0   1    0            0
3  2013-01-10                               0   0    0            0
4  2013-01-11                   Fog-Rain    1   1    0            0
5  2013-01-12                       Snow    0   0    1            0
6  2013-01-13                  Rain-Snow    1   0    1            0
7  2013-01-14          Rain-Thunderstorm    1   0    0            1
8  2013-01-15               Thunderstorm    0   0    0            1
9  2013-01-16      Fog-Rain-Thunderstorm    1   1    0            1
10 2013-01-17           Fog-Thunderstorm    0   1    0            1
11 2013-01-18 Fog-Rain-Thunderstorm-Snow    1   1    1            1

好的修改! - rnso

2

我认为在这种情况下,您需要调用函数dummy。让我们称目标列为target_cat

df_target_bin <- data.frame(dummy(target_cat, "<prefix>"))

这将创建一个新的数据框,其中每个target_cat的值都有一个包含0和1值的列。

要将列转换为逻辑型(即值为TRUEFALSE),请使用函数as.logical

df_target_logical <- apply(df_target_bin, as.logical)

网页内容由stack overflow 提供, 点击上面的
可以查看英文原文,
原文链接