在具有共同标签ID的Shape文件中合并多边形:unionSpatialPolygons

9
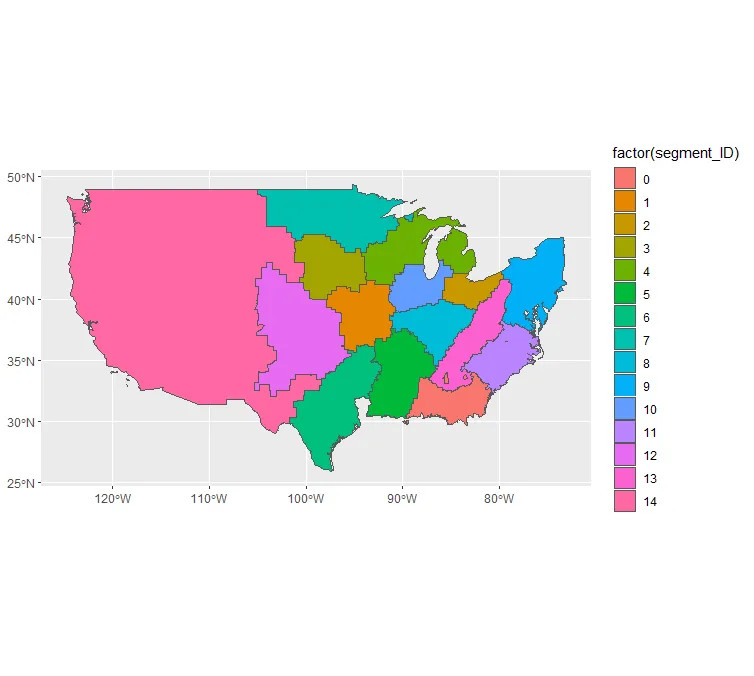
我正在尝试从一个形状文件中读取数据并合并具有相同标识ID的多边形。
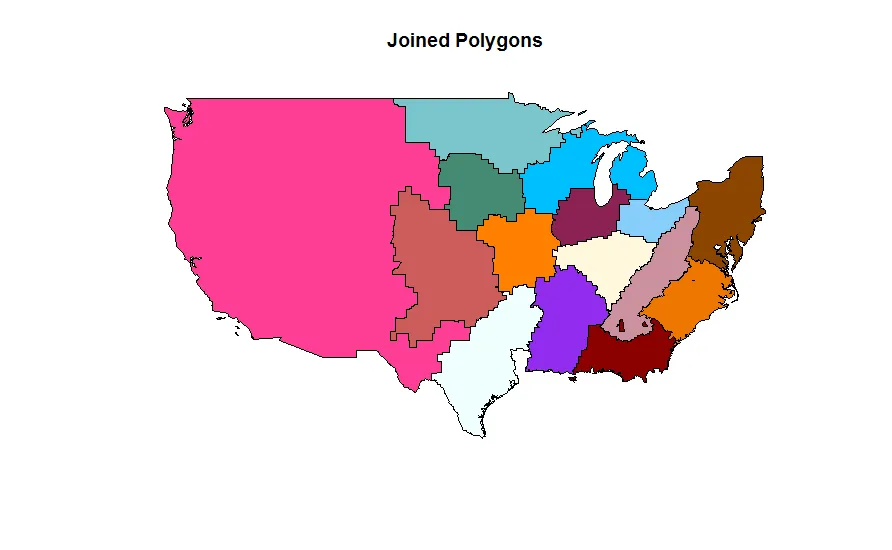
library(rgdal)
library(maptools)
if (!require(gpclib)) install.packages("gpclib", type="source")
gpclibPermit()

usa <- readOGR(dsn = "./path_to_data/", layer="the_name_of_shape_file")
usaIDs <- usa$segment_ID
isTRUE(gpclibPermitStatus())
usaUnion <- unionSpatialPolygons(usa, usaIDs)

当我尝试绘制合并的多边形时:
for(i in c(1:length(names(usaUnion)))){
  print(i)
  myPol <- usaUnion@polygons[[i]]@Polygons[[1]]@coords
  polygon(myPol, pch = 2, cex = 0.3, col = i)
}

enter image description here

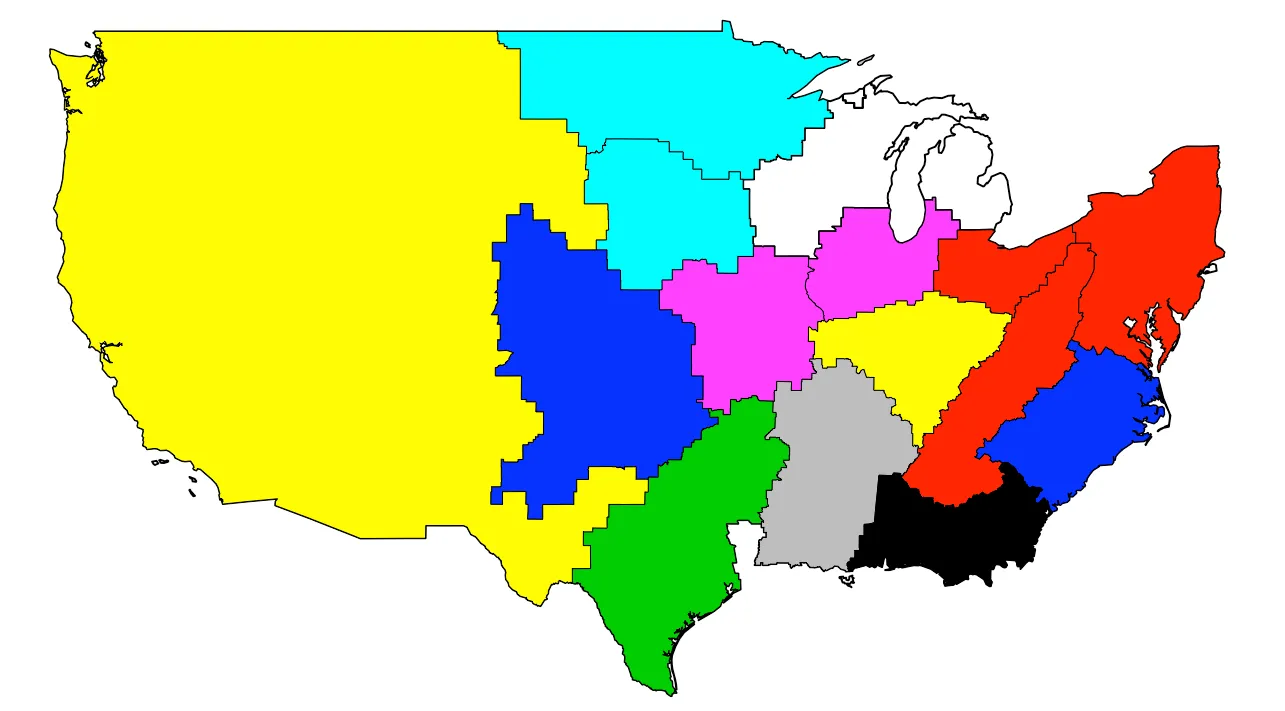
合并后的所有区段看起来都很好,除了那些在密歇根周围的区域,合并方式非常奇怪,导致该特定区段的结果区域仅为一个小多边形,如下图所示。
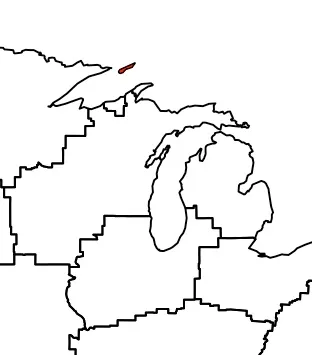
i = 10
usaUnion@polygons[[i]]@Polygons[[1]]@coords

输出:

          [,1]     [,2] 
 [1,] -88.62533 48.03317
 [2,] -88.90155 47.96025
 [3,] -89.02862 47.85066
 [4,] -89.13988 47.82408
 [5,] -89.19292 47.84461
 [6,] -89.20179 47.88386
 [7,] -89.15610 47.93923
 [8,] -88.49753 48.17380
 [9,] -88.62533 48.03317

这个小岛位于北部:

enter image description here

我怀疑问题出在unionSpatialPolygons函数不喜欢地理上分离的多边形[密歇根州左右两侧],但我还没有找到解决办法。

这是输入数据的链接,您可以进行复制。


您能否通过创建几个多边形的玩具示例来使其可重现,或以某种方式提供您的shapefile? - Calum You
我已经得到了shapefile,现在应该可以复制了。我会更新帖子并提供示例数据的链接。 - Rotail
2个回答

6

我认为问题不在于unionSpatialPolygons,而是你的绘图。具体来说,你只绘制了每个ID的第一个'子多边形'。运行以下命令以验证出了什么问题:

for(i in 1:length(names(usaUnion))){
  print(length(usaUnion@polygons[[i]]@Polygons))
}

对于这些内容,您只取了第一个。

我使用以下代码得到了正确的多边形连接/绘图:

library(rgdal)
library(maptools)
library(plyr)

usa <- readOGR(dsn = "INSERT_YOUR_PATH", layer="light_shape")
# remove NAs
usa <- usa[!is.na(usa$segment_ID), ]
usaIDs <- usa$segment_ID

#get unique colors
set.seed(666)
unique_colors <- sample(grDevices::colors()[grep('gr(a|e)y|white', grDevices::colors(), invert = T)], 15)

colors <- plyr::mapvalues(
  usaIDs, 
  from = as.numeric(sort(as.character(unique(usaIDs)))), #workaround to get correct color order
  to = unique_colors
)
plot(usa, col = colors, main = "Original Map")


usaUnion <- unionSpatialPolygons(usa, usaIDs)
plot(usaUnion, col = unique_colors, main = "Joined Polygons")

enter image description here

enter image description here


4
这里有一个使用sf绘制图表的例子,突出了该软件包与dplyrsummarise一起使用的能力,使这个操作非常简洁。我使用filter过滤掉缺失的ID,group_by ID,summarise(默认是联合),并轻松使用geom_sf进行绘图。
library(tidyverse)
library(sf)
# Substitute wherever you are reading the file from
light_shape <- read_sf(here::here("data", "light_shape.shp"))
light_shape %>%
  filter(!is.na(segment_ID)) %>% 
  group_by(segment_ID) %>%
  summarise() %>%
  ggplot() +
  geom_sf(aes(fill = factor(segment_ID)))

enter image description here


网页内容由stack overflow 提供, 点击上面的
可以查看英文原文,
原文链接