找出由一组直线创建的平面所有的划分方式

6

我有一组直线(形式为y=mx+b的线性函数)(共120条!),如果我把它们全部绘制出来,那么它们会将R^2平面分割开。这些线不一定经过原点。

如何有效地找到由一组这样的线创建的所有分区?就我个人而言,我很难想出任何方法,更不用说高效的方法了。为了更清晰明确,我包括以下仅显示4条线的图像: ste of lines

一个分区的例子是集合{(x,y)| -30x+28<= y && 60x+2 <= y <= 90x+7} ,它是第一象限的红色、黄色和绿色线所创建的分区。另一个例子是{(x,y)|y <= -30x+28 && 5x+3 <= y <= 60x+2},它是第一象限中由蓝色、红色和绿色线界定的三角形。

一个非分割的例子是 { (x,y) | 5x+3 <= y <= -30x+28 },它是由上面的绿线和下面的蓝线界定的集合。这不是一个分割,因为其中包含了几个分割(例如上面的第二个集合),或者与之重叠。然而,集合 { (x,y) | 5x+3 <= y <= -30x+28 && 90x+7 <= y } 就是一个分割。
所需输出是这些集合的完整列表:{(x,y)|y <= -30x+28 && 5x+3 <= y <= 60x+2},{(x,y)| -30x+28<= y && 60x+2 <= y <= 90x+7}... 等等。当然,它们不必以这种符号表示。
我不确定如何解决这个问题,所以很遗憾无法提供我尝试过的内容。理想情况下,我希望使用R、Python、Mathematica或MATLAB来完成此任务,但目前我对任何选项都持开放态度。
编辑:由于符号表示存在问题,我将稍作说明。获取满足某些条件的点的列表即可定义一个分区,对于所有满足该条件的点。例如,交集的长列表是可以接受的:y <= 5x+3 && y >= 90x+7 && y<= -30x+28 是完美的输出,定义了一个分区。当然,所需的输出是上述所有分区的完整列表。

2
期望的输出是什么? - Reblochon Masque
1
强调需要所需的输出。这只是将几个边框转换为多边形的问题。请参见此处的示例:https://gis.stackexchange.com/questions/23931/how-to-intersect-lines-and-polygons-in-r - MichaelChirico
有些相关 https://stackoverflow.com/questions/7022082/how-to-find-closed-loops-in-graph-networks - mikuszefski
1
这个问题被称为“线的排列”,并已经得到了广泛的研究。https://en.wikipedia.org/wiki/Arrangement_of_lines - user1196549
由于还没有人提到,您可能想了解一下qhull。 - user354134
显示剩余2条评论
5个回答

4
找到分区数量遵循以下公式(当没有3条或更多的线在同一点相交时-这个假设贯穿整个帖子):
num_partitions = (n_lines * (n_lines + 1) / 2 ) + 1

这里可以找到一个解释这里, 还有一个那里

所需的输出将是这些集合的完整列表: {(x,y)|y <= -30x+28 && 5x+3 <= y <= 60x+2}, {(x,y)| -30x+28<= y && 60x+2 <= y <= 90x+7}... 等等...当然,它们不必以此符号给出。

在这里缺乏精确的符号表示是一个障碍。

以下是我粗略的尝试。如您所见,可以根据它们相对于每条线的位置来标识编号区域。
有5个空集,如果线条顺序改变,这些集合将不会相同。
使用线在平面上划分点集可能更容易,尝试确定哪个点属于哪个集合; 在这种情况下,探索 2^n 潜在分区,并返回它们的内容将很容易。(比尝试找到用于标识抽象集合的良好符号更容易)

enter image description here

这并不能完全回答你的问题,但可能是对于那些有能力/愿意进一步推动此事的人来说一个好的起点。
这里有一个关于在平面上用两条线分割点集的注意事项。 虽然它是一个不同的问题,但其中的一些方法可能会有用。

其他方法:

识别由线段形成的多边形,计算凸包,确定一个点是否在凸包内。


这里有一些不错的想法,但是如果像 OP 一样有 120 行,你的 2^n 分区就是 O(10^36),探索起来可能会非常昂贵! - Wolfie
是的,我同意,但我认为这种方法中隐藏着更好的方式:如果我们走每个区域识别点的路线,这比定义一个区域要容易得多,我们很可能(虽然我没有证据)在O(num_points * num_partitions * log(max(num_points, num_partitions)))内扫描。无论如何,如果您要枚举区域,正如OP打算做的那样,您别无选择,只能逐个遍历它们。 - Reblochon Masque
当然,您首先要检查没有三条线通过同一点 - OP没有提到这是一个给定的条件。递归方法使用分区集很快就会失控,因此我认为扫描平面是个好主意。 - Mr. T
1
很不幸,在许多情况下,三条或更多线条在某个点相交。这些线有时非常接近,并且有120条,因此在我的情况下无法避免。 - Atom Vayalinkal
不要平行线,也不要让超过两条线在同一点相交。 - Reblochon Masque
显示剩余4条评论

2

这里提供一种Mathematica的解决方案。该方法涉及查找线段交点、线段片段以及分区,同时跟踪连接到哪些线段的点。
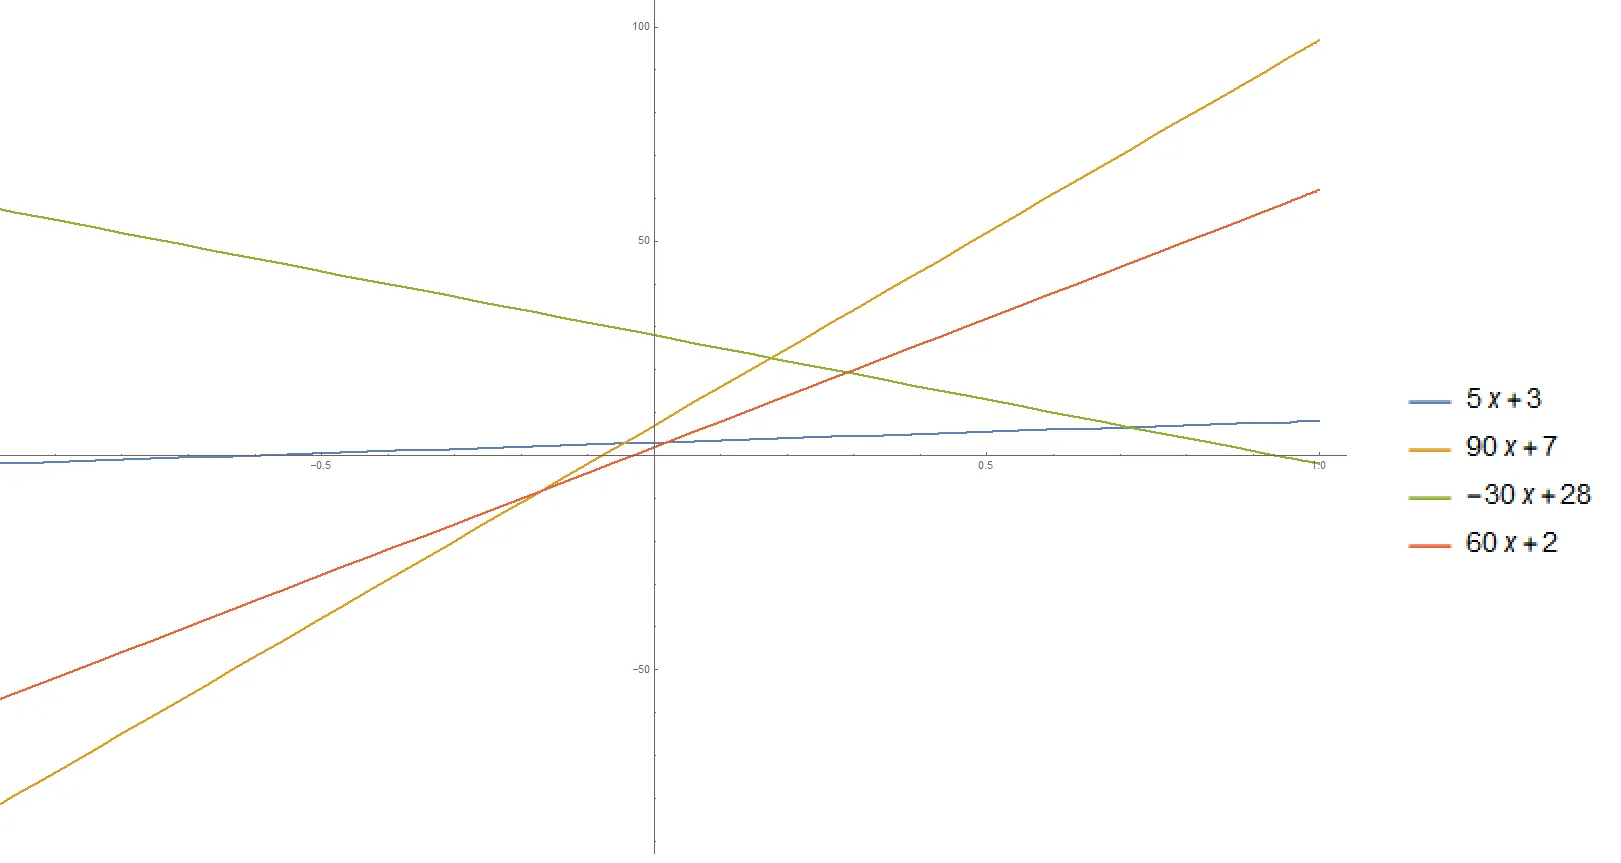
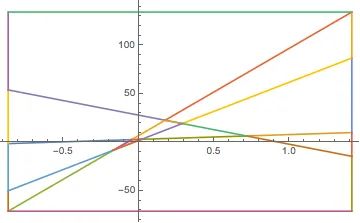
y[1] = 5 x + 3;
y[2] = 90 x + 7;
y[3] = -30 x + 28;
y[4] = 60 x + 2;

findpoints[n_] := Module[{},
  xp = DeleteCases[{{First[#1], First[#2]},
       Solve[Last[#1] == Last[#2], x]} & @@@
     DeleteCases[
      Tuples[Array[{#, y[#]} &, n], 2],
      {{x_, _}, {x_, _}}], {_, {}}];
  yp = y[#[[1, 1]]] /. #[[2, 1]] & /@ xp;
  MapThread[{#1, {#2, #3}} &,
   {xp[[All, 1]], xp[[All, 2, 1, 1, 2]], yp}]]

xyp = findpoints[4];

{xmin, xmax} = Through[{Min, Max}@
    xyp[[All, 2, 1]]] + {-0.7, 0.7};

outers = Flatten[Array[Function[n,
     MapThread[List[{{n, 0}, {##}}] &,
      {{xmin, xmax}, y[n] /.
    List /@ Thread[x -> {xmin, xmax}]}]], 4], 2];

xyp = Join[outers, xyp];

findlines[p_] := Module[{},
  pt = DeleteCases[
    Cases[xyp, {{p[[1, 1]], _}, _}], p];
  n = First@Cases[pt,
     {_, First@Nearest[Last /@ pt, Last[p]]}];
  {{First[p], First[n]}, {Last[p], Last[n]}}]

lines = Map[findlines, xyp];

(* boundary lines *)
{ymin, ymax} = Through[{Min, Max}@outers[[All, 2, 2]]];
{lbtm, rbtm, ltop, rtop} = {{xmin, ymin},
   {xmax, ymin}, {xmin, ymax}, {xmax, ymax}};
xminlines = Partition[Union@Join[{ymin, ymax},
      Cases[xyp, {_, {xmin, _}}][[All, 2, 2]]], 2, 1] /.
   x_Real :> {xmin, x};
xmaxlines = Partition[Union@Join[{ymin, ymax},
      Cases[xyp, {_, {xmax, _}}][[All, 2, 2]]], 2, 1] /. 
   x_Real :> {xmax, x};
lines2 = Join[Last /@ lines, xminlines, xmaxlines,
   {{lbtm, rbtm}}, {{ltop, rtop}}];

ListLinePlot[lines2]

enter image description here

(* add vertex points *)
xyp2 = Join[xyp, {
   {{SortBy[Cases[outers, {_, {xmin, _}}],
       Last][[-1, 1, 1]], -1}, ltop},
   {{SortBy[Cases[outers, {_, {xmax, _}}],
       Last][[-1, 1, 1]], -1}, rtop},
   {{SortBy[Cases[outers, {_, {xmin, _}}],
       Last][[1, 1, 1]], -1}, lbtm},
   {{SortBy[Cases[outers, {_, {xmax, _}}],
       Last][[1, 1, 1]], -1}, rbtm}}];

anglecalc[u_, v_] := Mod[(ArcTan @@ u) - (ArcTan @@ v), 2 π]

getlineangles[] := Module[{},
  (* find the angles from current line
     to all the linked lines *)
  angle = Map[
    anglecalc[{c, d} - {g, h}, # - {g, h}] &,
    union = DeleteCases[Union@Join[
        Last /@ Cases[lines2, {{g, h}, _}],
        First /@ Cases[lines2, {_, {g, h}}]],
      {c, d}]];
  Sort[Transpose[{N@angle, union}]]]

getpolygon[pt_, dir_] := Module[{},
  Clear[p];
  p[n = 1] = {{a, b}, {c, d}} = pt;
  (* find the angles from vector (0, -1) or (0, 1)
     to all the linked lines *)

  angle = Map[anglecalc[If[dir == 1, {0, -1}, {0, 1}], # - {c, d}] &,
    union = Union@Join[
       Last /@ Cases[lines2, {{c, d}, _}],
       First /@ Cases[lines2, {_, {c, d}}]]];
  lineangles = Sort[Transpose[{N@angle, union}]];
  (* next point *)
  p[++n] = {{e, f}, {g, h}} = First@
     Cases[xyp2, {_, lineangles[[1, 2]]}];

  While[Last[p[n]] != Last[p[1]],
   lineangles = getlineangles[];
   (* reset first point *)
   {{a, b}, {c, d}} = {{e, f}, {g, h}};
   (* next point *)
   p[++n] = {{e, f}, {g, h}} = First@
      Cases[xyp2, {_, lineangles[[1, 2]]}]];

  Array[p, n]]

len = Length[xyp];

polygons = Join[Array[(poly[#] = getpolygon[xyp[[#]], 1]) &, len],
   Array[(poly[# + len] = getpolygon[xyp[[#]], 2]) &, len]];

graphics = DeleteDuplicates /@ Array[Last /@ poly[#] &, 2 len];

sortedgraphics = Sort /@ graphics;

positions = Map[Position[sortedgraphics, #] &,
    DeleteDuplicates[sortedgraphics]][[All, 1, 1]];

unique = poly /@ positions;

poly2 = unique[[All, All, 2]];

poly2 = Delete[poly2,
   Array[If[Length[Intersection[poly2[[#]],
         Last /@ Take[xyp2, -4]]] == 4, {#}, Nothing] &,
    Length[poly2]]];

len2 = Length[poly2];

poly3 = Polygon /@ Rest /@ poly2;

Array[(centroid[#] = RegionCentroid[poly3[[#]]]) &, len2];

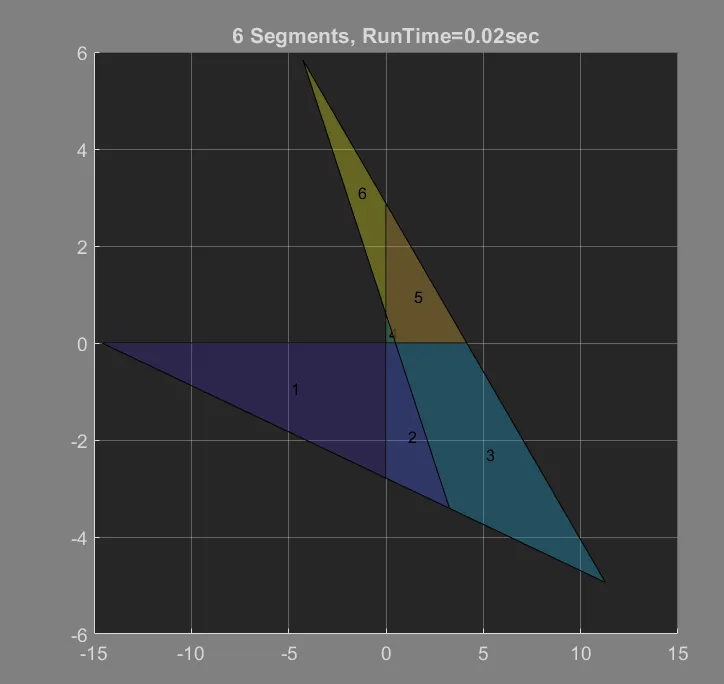
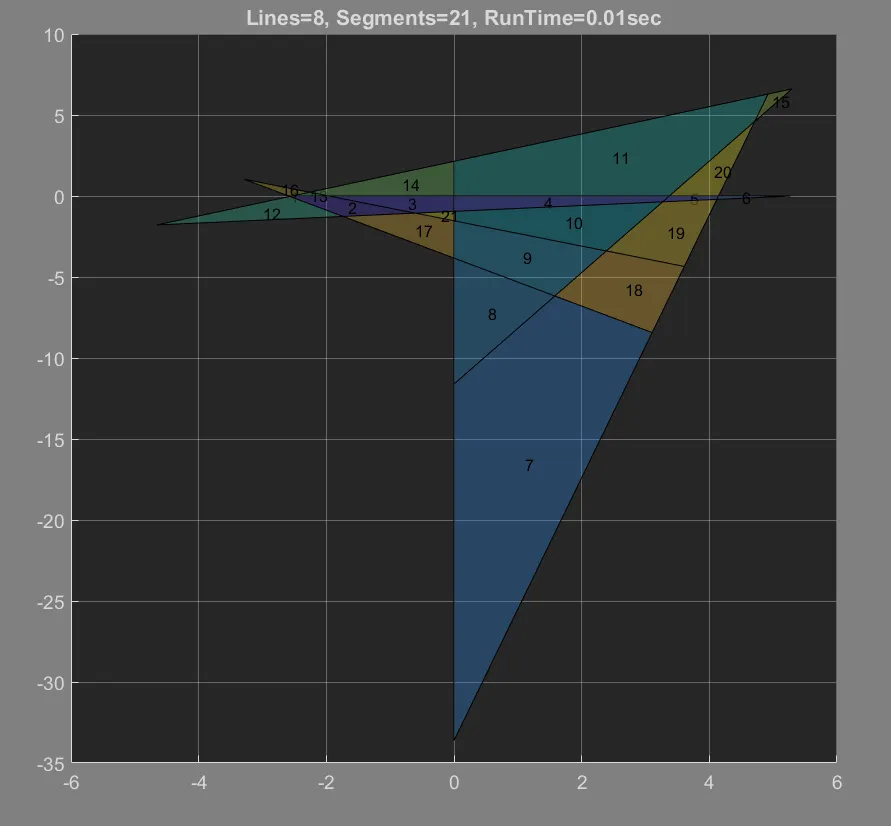
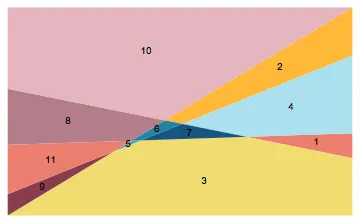
Show[Graphics[Array[{ColorData[24][#],
     poly3[[#]]} &, len2], AspectRatio -> 1/GoldenRatio],
 Graphics[Array[Text[#, centroid[#]] &, len2]]]

enter image description here

unique2 = Extract[unique,
   Flatten[Position[unique[[All, All, 2]], #] & /@ poly2, 1]];

makerelations[oneconnection_, areanumber_] := Module[{i},
  If[Intersection @@ oneconnection == {} ||
    (i = First[Intersection @@ oneconnection]) < 1,
   Nothing,
   centroidx = First[centroid[areanumber]];
   linepos = y[i] /. x -> centroidx;
   relation = If[linepos < Last[centroid[areanumber]],
     " >= ", " < "];
   string = StringJoin["y", relation, ToString[y[i]]]]]

findrelations[n_] := Module[{},
  areanumber = n;
  onearea = unique2[[areanumber]];
  connections = Partition[First /@ onearea, 2, 1];
  strings = DeleteDuplicates@
    Map[makerelations[#, areanumber] &, connections];
  StringJoin["Area ", ToString[areanumber],
   If[areanumber > 9, ": ", ":  "],
   StringRiffle[strings, " &&\n         "]]]

Show[Plot[Evaluate@Array[y, 4], {x, -1, 1.5},
  PlotLegends -> "Expressions", Axes -> None],
 Graphics[Array[Text[#, centroid[#]] &, len2]]]

Column@Array[findrelations, len2]

enter image description here

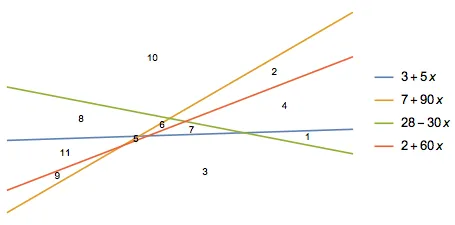
Area 1:  y >= 28 - 30 x &&
         y < 3 + 5 x
Area 2:  y >= 2 + 60 x &&
         y >= 28 - 30 x &&
         y < 7 + 90 x
Area 3:  y < 28 - 30 x &&
         y < 7 + 90 x &&
         y < 2 + 60 x &&
         y < 3 + 5 x
Area 4:  y >= 3 + 5 x &&
         y >= 28 - 30 x &&
         y < 2 + 60 x
Area 5:  y < 3 + 5 x &&
         y >= 2 + 60 x &&
         y < 7 + 90 x
Area 6:  y < 28 - 30 x &&
         y >= 2 + 60 x &&
         y >= 3 + 5 x &&
         y < 7 + 90 x
Area 7:  y < 28 - 30 x &&
         y >= 3 + 5 x &&
         y < 2 + 60 x
Area 8:  y < 28 - 30 x &&
         y >= 7 + 90 x &&
         y >= 3 + 5 x
Area 9:  y < 2 + 60 x &&
         y >= 7 + 90 x
Area 10: y >= 28 - 30 x &&
         y >= 7 + 90 x
Area 11: y < 3 + 5 x &&
         y >= 7 + 90 x &&
         y >= 2 + 60 x

2

完整的Matlab解决方案。120行7021个分区,在0.4秒内进行原始计算(绘图需要额外2秒)。

完成。

clear
tic
%rng(15) % fix rng for debug
NLines=9;
DRAW_FINAL_POLY= true==true ; %false true
DRAW_FINALTEXT= true==true ; %false true
DRAW_LINES= false==true; %false true
DRAW_DEBUG= false==true; %false true

% part a - generate lines
NORM_EPS=1e-10;
Lines=10*(rand(NLines,4)-0.5); %(x1,y1,x2,y2)
Color=rand(NLines,3);
Lines(1,:)=[-10,0,+10,0];% x axis if we want to add asix as lines
Lines(2,:)=[0,-10,0,+10];% y axis
Color(1,:)=[1,0,0];% x axis red
Color(2,:)=[0,1,0];% y axis green
Color(3,:)=[0,0,1];% third blue

AllPairs=sortrows(combnk(1:NLines,2));
NPairs=size(AllPairs,1);
[px,py,isok,d] = LineIntersection(Lines(AllPairs(:,1),:) , Lines(AllPairs(:,2),:));
% draw lines and intersections
figure(7); cla; ax=gca;axis(ax,'auto');
if DRAW_LINES
    for iline=1:size(Lines,1)
        line(ax,Lines(iline,[1 3]),Lines(iline,[2 4]),'LineWidth',2','Color',Color(iline,:)); %draw partial line defined by points x1y1x2y2
    end
    for i=1:NPairs %extraploate line to intersection point
        iline1=AllPairs(i,1);
        iline2=AllPairs(i,2);
        line(ax,[Lines(iline1,[1]),px(i)],[Lines(iline1,[2]),py(i)],'LineWidth',2','Color',Color(iline1,:));
        line(ax,[Lines(iline2,[1]),px(i)],[Lines(iline2,[2]),py(i)],'LineWidth',2','Color',Color(iline2,:));
    end
    line(ax,px,py,'LineStyle','none','Marker','*','MarkerSize',8,'Color','g');%draw intersection points
    for i=1:NPairs
        text(px(i)+0.2,py(i)+0.2,sprintf('%d',i),'FontSize',14,'Color','c')
    end
end

% part b - find regions
% 1 for each line sort all its intersections
SortIntr=cell(1,NLines); %(if no parallel lines than NintrsctnsPerline = NLines-1)
IpairiIdx1=cell(1,NLines);
IpairiIdx2=cell(1,NLines);
IpairiIdxI=cell(1,NLines);
for iline=1:NLines
    [idx1,idx2]=find(AllPairs==iline);
    intr=[px(idx1),py(idx1)];
    [~, Isortedintr]=sortrows(intr.*[1,1]); %sort by increaing x y. (prepare clockwise travers)
    SortIntr{iline}=intr(Isortedintr,:);
    IpairiIdx1{iline}=idx1(Isortedintr);
    IpairiIdx2{iline}=3-idx2(Isortedintr); %keep indexes of second line
    IpairiIdxI{iline}=Isortedintr;
end
% 2 traverse from every point and find next closest intersctionn
% we go clockwise x+x-y
PointsInPartition={};
SolIndexInPartition={};
LineIndexInPartition={};
Line4PointsInPartition={};
VisitedSequence=false(NPairs,NPairs); %skip same sequence
count_added=0; count_skipped=0;

for iline=1:NLines
    for ipoint_idx=1:length(SortIntr{iline})-1 %cant start from last point in line
        ipoint=SortIntr{iline}(ipoint_idx,:);
        if DRAW_DEBUG
            delete(findall(ax,'Tag','tmppoint'));
            line(ax,ipoint(1),ipoint(2),'LineStyle','none','Marker','O','MarkerSize',12,'Color','r','tag','tmppoint');%draw intersection points
        end
        current_line=iline;
        isol_idx=IpairiIdx1{current_line}(ipoint_idx);
        current_p_idx=ipoint_idx;
        current_l_next_p_idx=current_p_idx+1;
        next_line=AllPairs(IpairiIdx1{current_line}(current_l_next_p_idx), IpairiIdx2{current_line}(current_l_next_p_idx));
        % next_point_idx = find(IpairiIdx1{current_line}(next_point_idx)==IpairiIdx1{next_line});
        sol_idx_list=[isol_idx]; 
%       if ismember(isol_idx,[7,8,12]),keyboard;end
        point_list=[ipoint];
        line_list=[iline];
        while next_line~=iline
            if DRAW_DEBUG
                delete(findall(ax,'Tag','tmpline'));
                line(ax,Lines(current_line,[1 3]),Lines(current_line,[2 4]),'LineWidth',4','Color',[ 0,0,0 ],'Tag','tmpline');
                line(ax,Lines(next_line,[1 3]),Lines(next_line,[2 4]),'LineWidth',4','Color',[ 1,1,1 ],'Tag','tmpline');
            end
            current_sol_idx=IpairiIdx1{current_line}(current_l_next_p_idx);
            current_p_idx = find(IpairiIdx1{next_line}==current_sol_idx);
            current_line=next_line;
            current_point=SortIntr{current_line}(current_p_idx,:);
            current_nrm=norm(current_point-ipoint);
            current_o=atan2d(-current_point(2)+ipoint(2),current_point(1)-ipoint(1));

            sol_idx_list(end+1)=current_sol_idx; %#ok<SAGROW>
            point_list(end+1,:)=current_point; %#ok<SAGROW>
            line_list(end+1)=current_line;
            if DRAW_DEBUG,line(ax,current_point(1),current_point(2),'LineStyle','none','Marker','O','MarkerSize',12,'Color','m','tag','tmppoint');end %draw intersection points
            %select between two options. next clockwise point is the one with higher angle
            if current_p_idx+1<=length(SortIntr{current_line}) && current_p_idx-1>0
                next_point_1=SortIntr{current_line}(current_p_idx+1,:);
                next_point_2=SortIntr{current_line}(current_p_idx-1,:);
                if norm(next_point_1-ipoint)<NORM_EPS
                    current_l_next_p_idx=current_p_idx+1;
                elseif norm(next_point_2-ipoint)<NORM_EPS
                    current_l_next_p_idx=current_p_idx-1;
                else
                    o1=atan2d(-next_point_1(2)+ipoint(2),next_point_1(1)-ipoint(1));
                    o2=atan2d(-next_point_2(2)+ipoint(2),next_point_2(1)-ipoint(1));
                    if o1>o2
                        current_l_next_p_idx=current_p_idx+1;
                    else
                        current_l_next_p_idx=current_p_idx-1;
                    end
                end
            elseif current_p_idx-1>0
                current_l_next_p_idx=current_p_idx-1;
            else
                current_l_next_p_idx=current_p_idx+1;
            end

            next_p=SortIntr{current_line}(current_l_next_p_idx,:);
            next_o=atan2d(-next_p(2)+ipoint(2),next_p(1)-ipoint(1));
            next_nrm=norm(next_p-ipoint);
            if DRAW_DEBUG,disp([current_nrm,next_nrm,current_o,next_o]);end
            next_line=AllPairs(IpairiIdx1{current_line}(current_l_next_p_idx), IpairiIdx2{current_line}(current_l_next_p_idx));
            next_sol_idx=IpairiIdx1{current_line}(current_l_next_p_idx);
            if VisitedSequence(current_sol_idx,next_sol_idx)
                next_line=-2;
                if DRAW_DEBUG,disp('seq visited');end
                break;
            end
            if next_nrm>NORM_EPS && next_o<current_o || next_o-current_o>180
                next_line=-2;
                if DRAW_DEBUG,disp('next_o<current_o');end
                break; %non clockwise
            end
            assert(next_nrm<NORM_EPS && next_line==iline || next_nrm>=NORM_EPS && next_line~=iline);
        end

        if next_line==iline
            sol_idx_list(end+1)=next_sol_idx; %#ok<SAGROW>
            point_list(end+1,:)=next_p; %#ok<SAGROW>
            PointsInPartition{end+1}=point_list; %#ok<SAGROW>
            SolIndexInPartition{end+1}=sol_idx_list; %#ok<SAGROW>
            %Line4PointsInPartition{end+1}=(Lines(AllPairs(sol_idx_list,1),:), [1; 0])+kron(Lines(AllPairs(sol_idx_list,2),:), [0; 1]);%#ok<SAGROW>
            Line4PointsInPartition{end+1}=Lines(line_list,:);%#ok<SAGROW>

            for i=1:length(sol_idx_list)-1
                VisitedSequence(sol_idx_list(i),sol_idx_list(i+1))=true;
            end
            count_added=count_added+1;
        else
            count_skipped=count_skipped+1;
        end
        if DRAW_DEBUG, disp([next_line==iline, count_added,count_skipped]);end
    end
end

% draw all segments
if DRAW_DEBUG %clear debug
    delete(findall(ax,'Tag','tmppoint'));
    delete(findall(ax,'Tag','tmpline'));
end
NPartition=length(PointsInPartition);
s=sprintf('Lines=%d, Segments=%d, RunTime=%1.2fsec',NLines,NPartition,toc);
title(ax,s);
fprintf([s,newline]);
if DRAW_FINAL_POLY
    hold(ax,'on');
    for i=1:NPartition
        plist=PointsInPartition{i};
        patch(plist(:,1),plist(:,2),i,'FaceAlpha',.3)
        [cx,cy]=ploygon_centroid(plist(:,1),plist(:,2));
        if(DRAW_FINALTEXT),text(cx,cy,sprintf('%d',i),'FontSize',12,'Color','k');end
    end
end

function [px,py,isok,d] = LineIntersection(Line1, Line2)
    %Line1=[x1,y1,x2,y2] Line2=[x3,y3,x4,y4]
    x1=Line1(:,1); y1=Line1(:,2); x2=Line1(:,3); y2=Line1(:,4);
    x3=Line2(:,1); y3=Line2(:,2); x4=Line2(:,3); y4=Line2(:,4);
    d=(x1-x2).*(y3-y4)-(y1-y2).*(x3-x4);%determinant
    px0=(x1.*y2-y1.*x2).*(x3-x4)-(x1-x2).*(x3.*y4-y3.*x4);
    py0=(x1.*y2-y1.*x2).*(y3-y4)-(y1-y2).*(x3.*y4-y3.*x4);
    isok=abs(d)>1e-6;
    px=px0./d;
    py=py0./d;
end

function [xc,yc] = ploygon_centroid(x,y)
    xs = circshift(x,-1);
    ys = circshift(y,-1);
    area = 0.5*sum (x.*ys-xs.*y);
    xc = sum((x.*ys-xs.*y).*(x+xs))/(6*area);
    yc = sum((x.*ys-xs.*y).*(y+ys))/(6*area);
end

Result of random 5 lines 8 lines


这真的很好,而且运行良好,但我真的在寻找一组集合列表。这个脚本可以很好地标记它们,并清楚地识别它们,但是我该如何检索已标记的集合列表? - Atom Vayalinkal
修复了一些错误。我添加了参与分区的行在变量“Line4PointsInPartition”中。 - Mendi Barel
1
@Piinthesky 不,我也对无界限制感兴趣。 - Atom Vayalinkal

1
编辑 新的解决方案,使用itertools。以下是旧的解决方案。 使用Python包itertools,我相信这个解决方案比原来的更快。然而,它仍然非常慢,超过20行以上就不可行了。对于120行,这些都将无法终止。
import itertools

strings = ["<=", ">="]

fxs = ["5x + 3", "-60x + 7", ...]

parts = []

if __name__ == "__main__":
    print(len(fxs))
    out = itertools.product(strings, repeat=len(fxs))
    for i in out:
        curpart = ""
        for j in range(len(i)):
            print(curpart)
            if j != len(i):
                curpart = curpart + "y " + i[j] + fxs[j] + " && "
            else:
                curpart = curpart + "y " + i[j] + fxs[j]
        parts.append(curpart)
    print(parts)

旧方案

以下是我在Python中最终使用的解决方案:

fxs = [list of functions as strings, ex: "5x+3","6x+4"... etc.]

parts = []


if __name__ == "__main__":
    for f in fxs:
        fhalf = "y >= " + f
        shalf = "y <= " + f
        if len(parts) == 0:
            parts.append(fhalf)
            parts.append(shalf)
        else:
            parts1 = [s + " && " + fhalf for s in parts]
            parts2 = [s + " && " + shalf for s in parts]
            parts = parts1 + parts2
    print(parts)

对于上面的例子,这将输出:
['y >= 5x+3 && y >= 90x+7 && y >= -30x+28 && y >= 60x+2', 'y <= 5x+3 && y >= 90x+7 && y >= -30x+28 && y >= 60x+2', 'y >= 5x+3 && y <= 90x+7 && y >= -30x+28 && y >= 60x+2', 'y <= 5x+3 && y <= 90x+7 && y >= -30x+28 && y >= 60x+2', 'y >= 5x+3 && y >= 90x+7 && y <= -30x+28 && y >= 60x+2', 'y <= 5x+3 && y >= 90x+7 && y <= -30x+28 && y >= 60x+2', 'y >= 5x+3 && y <= 90x+7 && y <= -30x+28 && y >= 60x+2', 'y <= 5x+3 && y <= 90x+7 && y <= -30x+28 && y >= 60x+2', 'y >= 5x+3 && y >= 90x+7 && y >= -30x+28 && y <= 60x+2', 'y <= 5x+3 && y >= 90x+7 && y >= -30x+28 && y <= 60x+2', 'y >= 5x+3 && y <= 90x+7 && y >= -30x+28 && y <= 60x+2', 'y <= 5x+3 && y <= 90x+7 && y >= -30x+28 && y <= 60x+2', 'y >= 5x+3 && y >= 90x+7 && y <= -30x+28 && y <= 60x+2', 'y <= 5x+3 && y >= 90x+7 && y <= -30x+28 && y <= 60x+2', 'y >= 5x+3 && y <= 90x+7 && y <= -30x+28 && y <= 60x+2', 'y <= 5x+3 && y <= 90x+7 && y <= -30x+28 && y <= 60x+2']

代码非常简单,输出结果完全符合要求。

基本思路是每条直线将平面分成两半,循环(迭代直线集)将已发现的每个分区与每半相交,并向集合中添加两个新的分区,同时删除原始未相交的分区。结果并不总是给出最简单的条件(有些条件可能是冗余的),但它们确实给出了每个分区的完整描述。

虽然这种解决方案可以使用120行,但速度相当慢。我很想看看是否有更有效的方法来完成这个任务,无论是使用这种方法还是其他方法。


这个好像不能正常工作,是吗?你没有考虑线之间的关系(例如是否都经过(0, 0)或者是否平行),因此无法做出正确的判断。即使没有特殊条件:你的策略也无法获取所有子集,例如两条线在你的脚本中只会产生三个分区。 - Mr. T
是的,我已经意识到它实际上并没有按照预期工作。原始脚本可以工作,但新的脚本却不能。我已经更新了答案,并提供了一个新的解决方案,虽然仍然非常缓慢。 - Atom Vayalinkal
我在谈论 itertools 程序。它有上述缺陷。用两行代码试试看。 - Mr. T
有了修复,itertools 代码可以工作,对于大约20行的数据。之后它变得太慢而不可行。 - Atom Vayalinkal

0

到目前为止,建议的替代方案是利用三角形进行工作。

从一组三角形(可能包含无穷远点)开始,它们的联合构成覆盖整个平面的多边形。例如,您可以从将第一个输入到算法的两条线分割而成的四个三角形开始,或者取由原点O、OX轴正侧和与OX成120度和240度的两个半线形成的三角形。

现在,对于每条输入线,您要寻找它穿过的三角形以及每一个交点,你都要用这个线把这些三角形切割并替换为覆盖相同区域的三个(或在退化情况下是两个)新三角形。然后,您必须找到旧的相交三角形所在的多边形,并根据它们所在的线段将它们中的每一个替换为由分裂其包含的三角形得出的两个多边形。

使用三角形的好处是可以使计算变得更容易,并且可以将它们推入某种索引数据结构中,例如K-d树,这将更快地计算哪些多边形被某些线段切割,您最终可能得到一个时间复杂度为O(NlogN)的算法,其中N是形成平面分区的多边形数量。


网页内容由stack overflow 提供, 点击上面的
可以查看英文原文,
原文链接