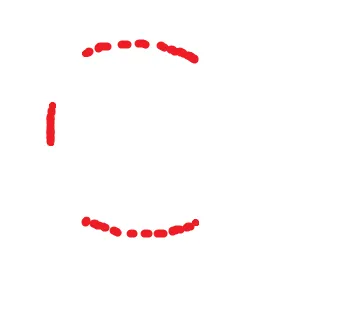
如果标题不够清晰,让我们假设我有一个图像列表(10k+),我正在寻找一个目标图像。
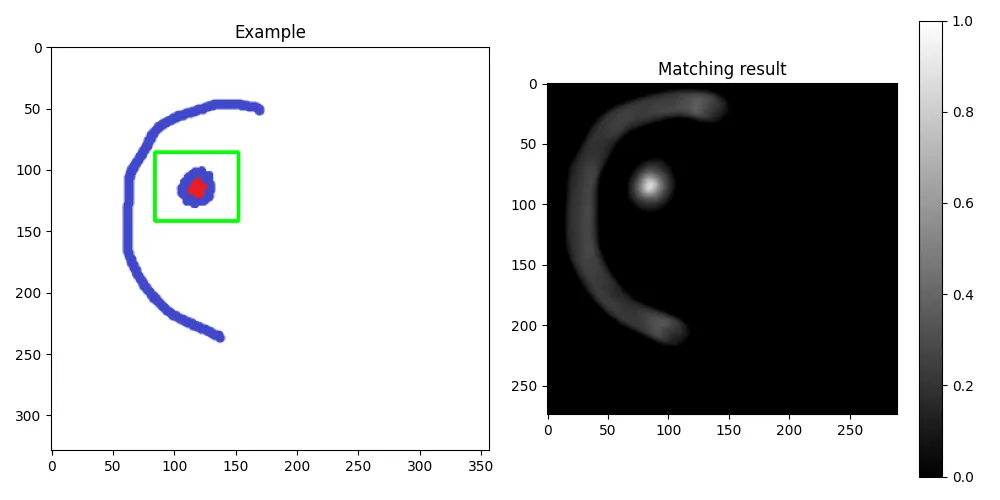
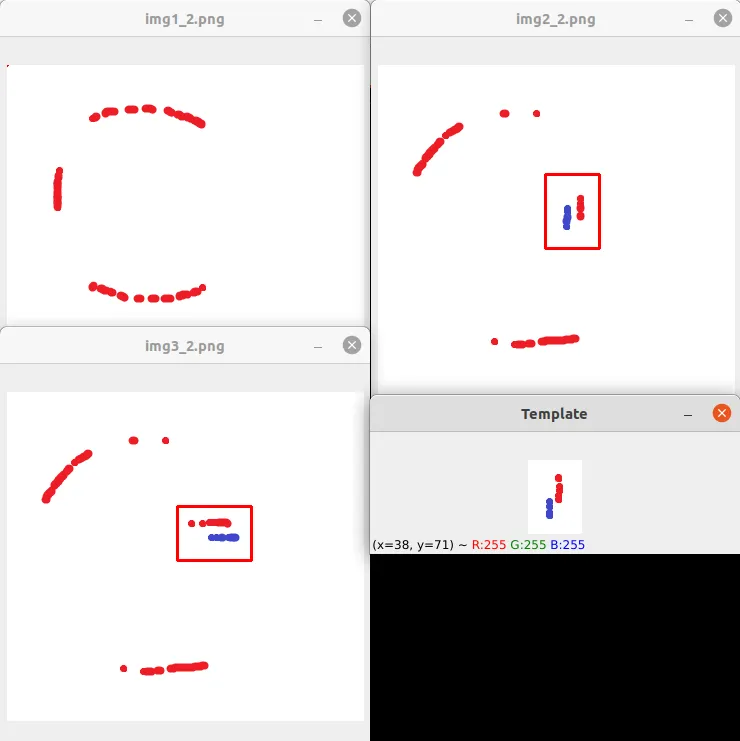
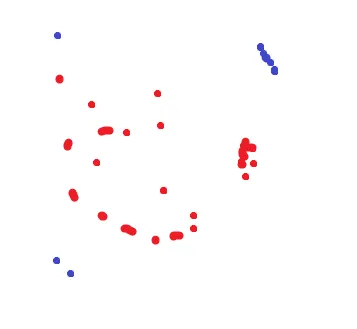
以下是目标图像的示例: 以下是我将要搜索以找到“相似”的图像的示例(ex1、ex2和ex3):
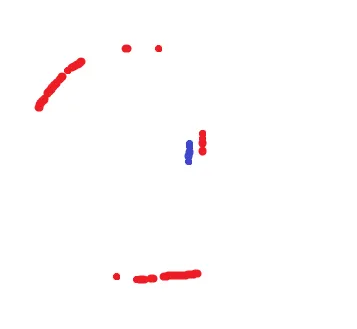
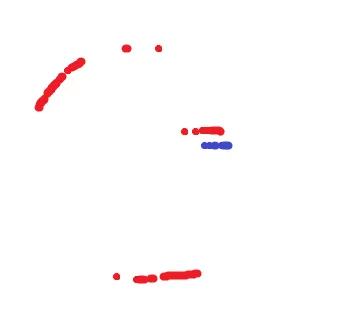
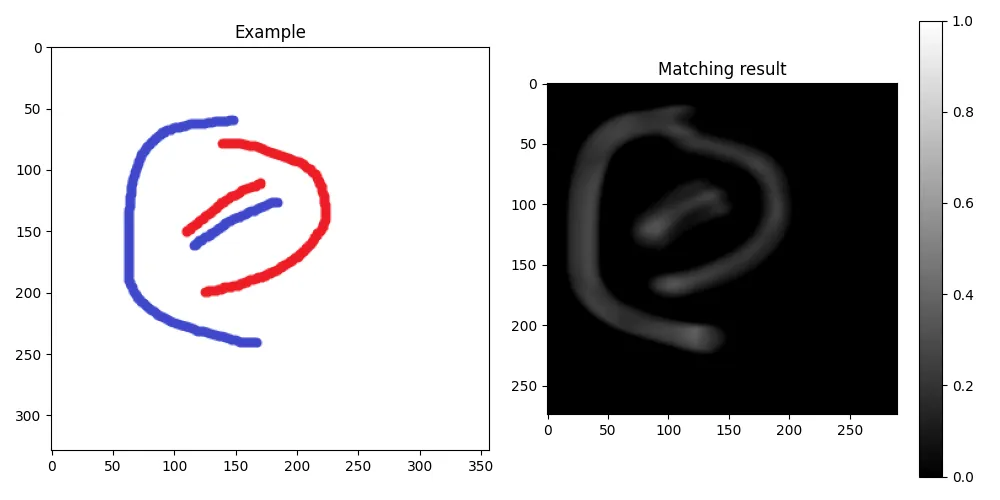
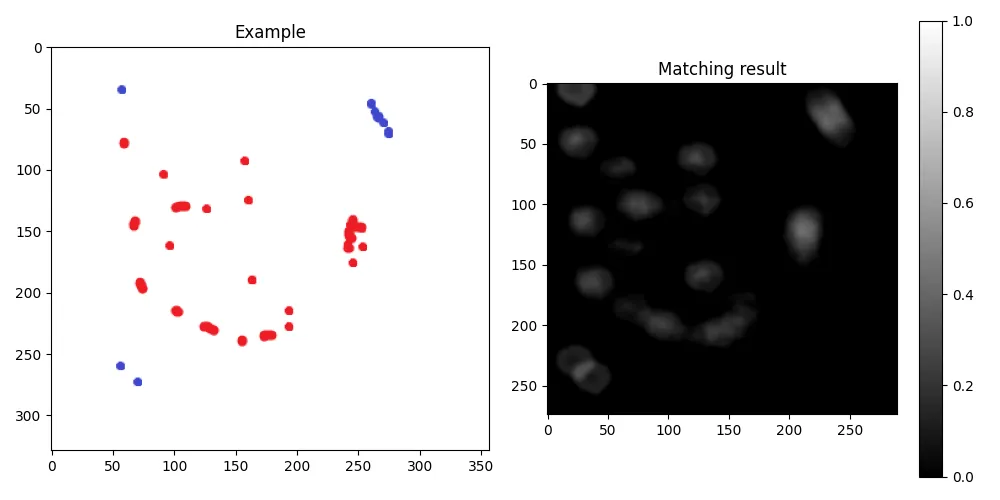
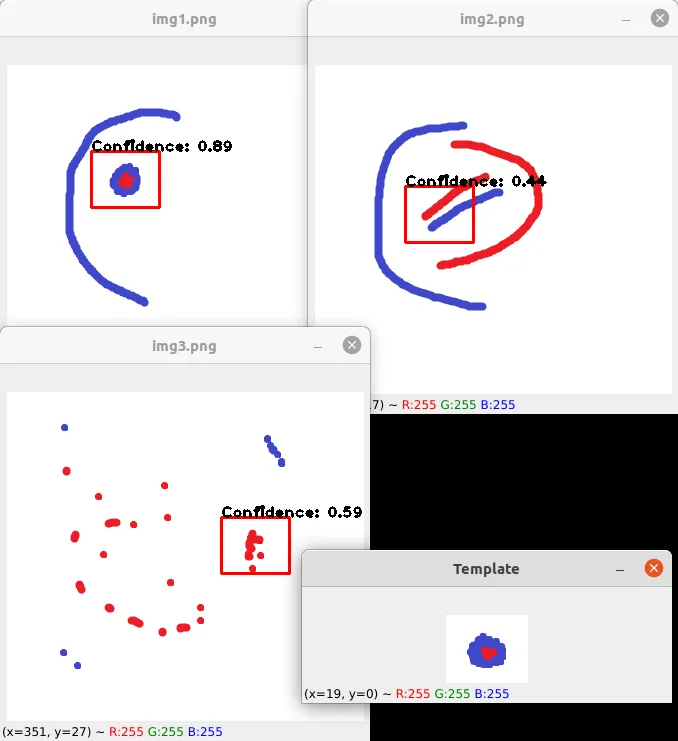
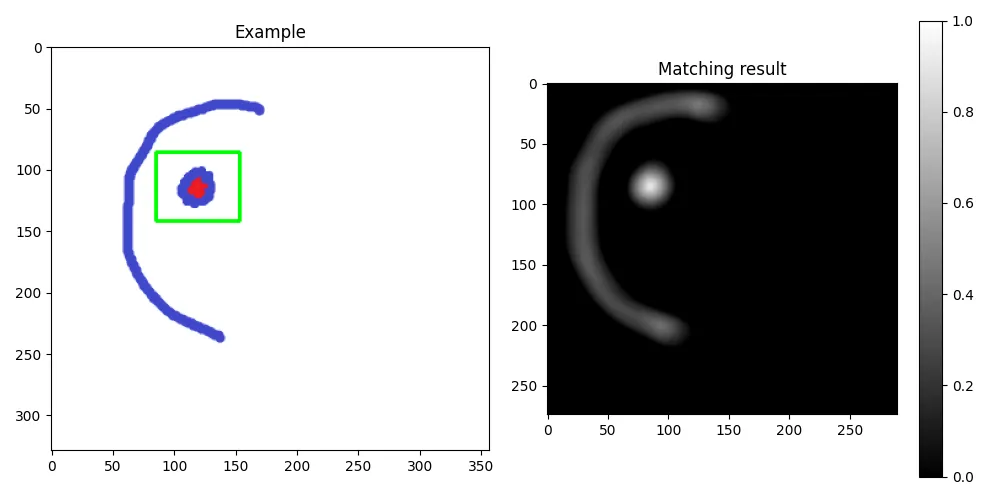
 这里是我所做的匹配(我使用KAZE)。
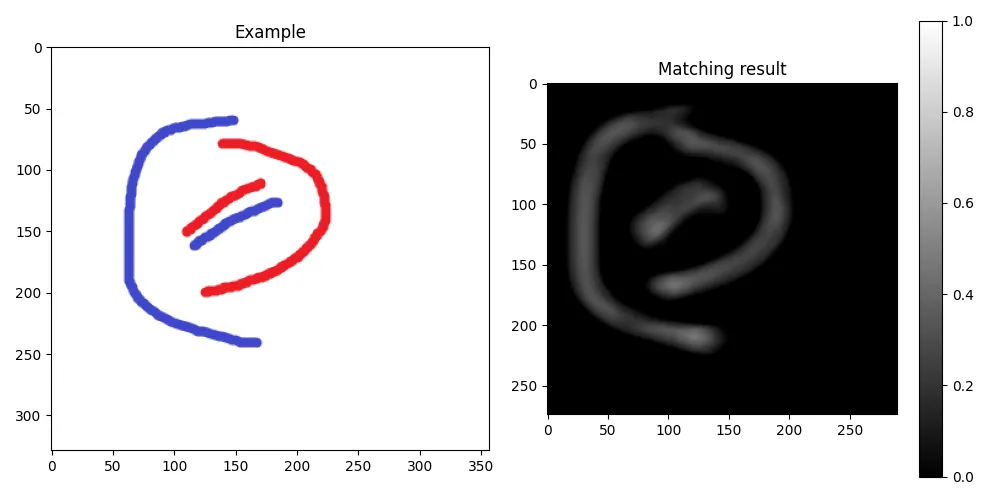
以下是目标图像的示例:
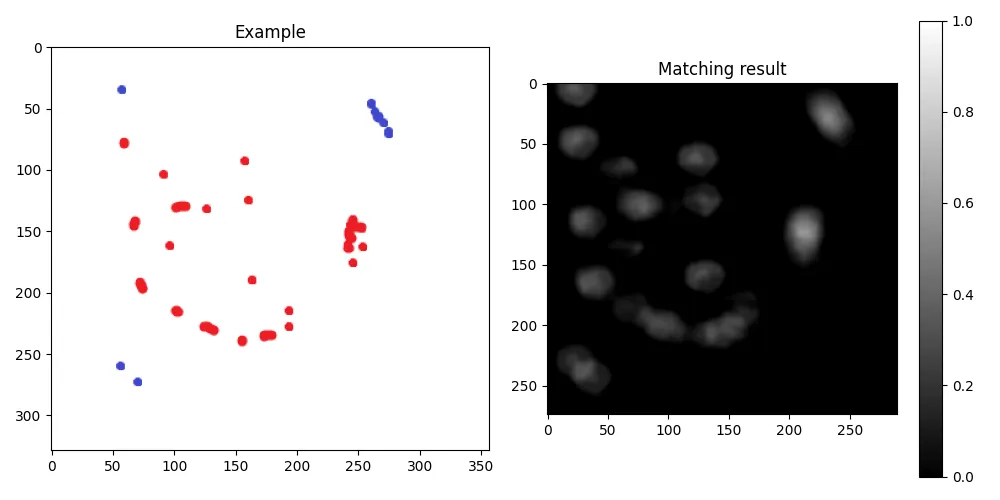
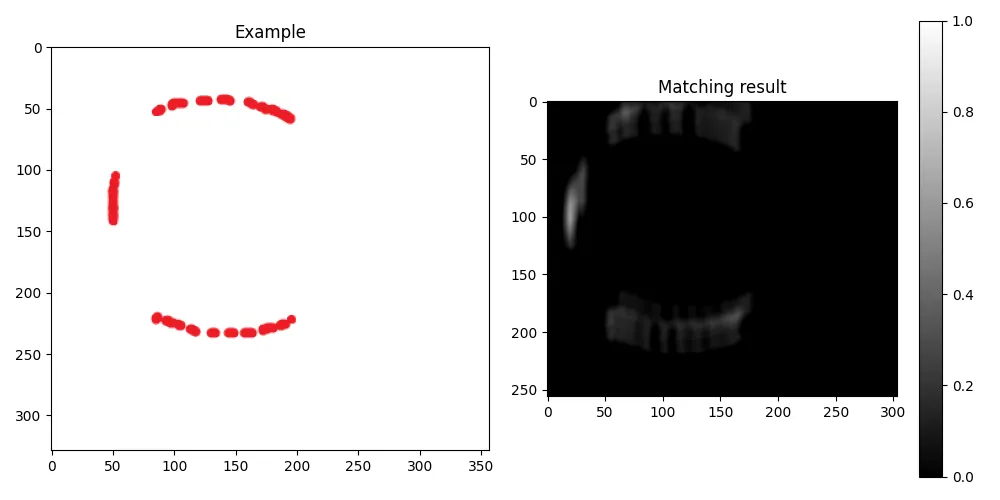
以下是我将要搜索以找到“相似”的图像的示例(ex1、ex2和ex3):
这里是我所做的匹配(我使用KAZE)。from matplotlib import pyplot as plt
import numpy as np
import cv2
from typing import List
import os
import imutils
def calculate_matches(des1: List[cv2.KeyPoint], des2: List[cv2.KeyPoint]):
"""
does a matching algorithm to match if keypoints 1 and 2 are similar
@param des1: a numpy array of floats that are the descriptors of the keypoints
@param des2: a numpy array of floats that are the descriptors of the keypoints
@return:
"""
# bf matcher with default params
bf = cv2.BFMatcher(cv2.NORM_L2)
matches = bf.knnMatch(des1, des2, k=2)
topResults = []
for m, n in matches:
if m.distance < 0.7 * n.distance:
topResults.append([m])
return topResults
def compare_images_kaze():
cwd = os.getcwd()
target = os.path.join(cwd, 'opencv_target', 'target.png')
images_list = os.listdir('opencv_images')
for image in images_list:
# get my 2 images
img2 = cv2.imread(target)
img1 = cv2.imread(os.path.join(cwd, 'opencv_images', image))
for i in range(0, 360, int(360 / 8)):
# rotate my image by i
img_target_rotation = imutils.rotate_bound(img2, i)
# Initiate KAZE object with default values
kaze = cv2.KAZE_create()
kp1, des1 = kaze.detectAndCompute(img1, None)
kp2, des2 = kaze.detectAndCompute(img2, None)
matches = calculate_matches(des1, des2)
try:
score = 100 * (len(matches) / min(len(kp1), len(kp2)))
except ZeroDivisionError:
score = 0
print(image, score)
img3 = cv2.drawMatchesKnn(img1, kp1, img_target_rotation, kp2, matches,
None, flags=2)
img3 = cv2.cvtColor(img3, cv2.COLOR_BGR2RGB)
plt.imshow(img3)
plt.show()
plt.clf()
if __name__ == '__main__':
compare_images_kaze()
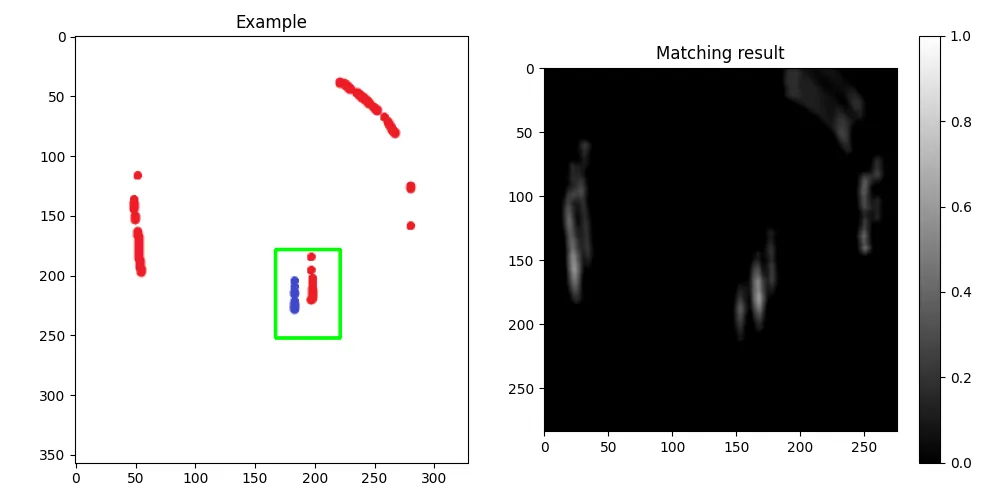
这是我的代码的输出结果:
ex1.png 21.052631578947366
ex2.png 0.0
ex3.png 42.10526315789473
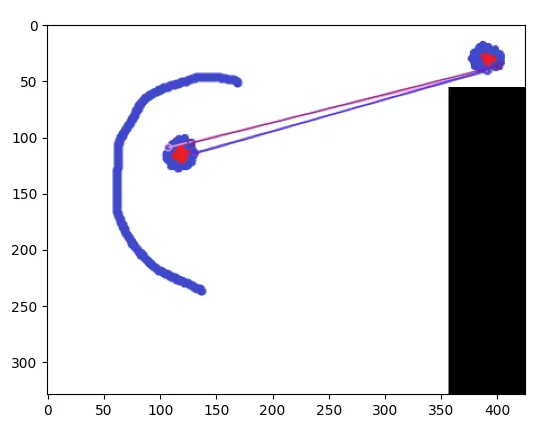

它的表现还不错!它能够判断ex1是相似的,而ex2不相似。但是它表示ex3是相似的(比ex1更相似)。是否有额外的预处理或后处理(可能使用机器学习,假设机器学习确实有用)或者只需更改我的方法即可仅保留ex1作为相似项而不是ex3?
(请注意,我创建的这个分数是我在网上找到的。不确定它是否是一种准确的方法)
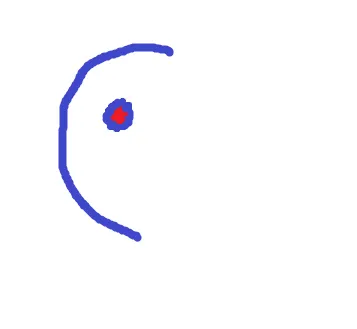
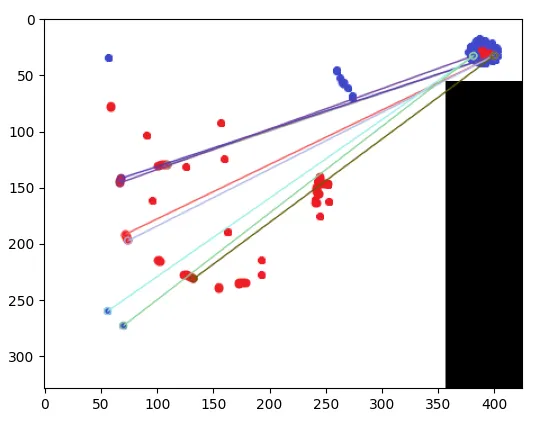
添加了更多示例如下:
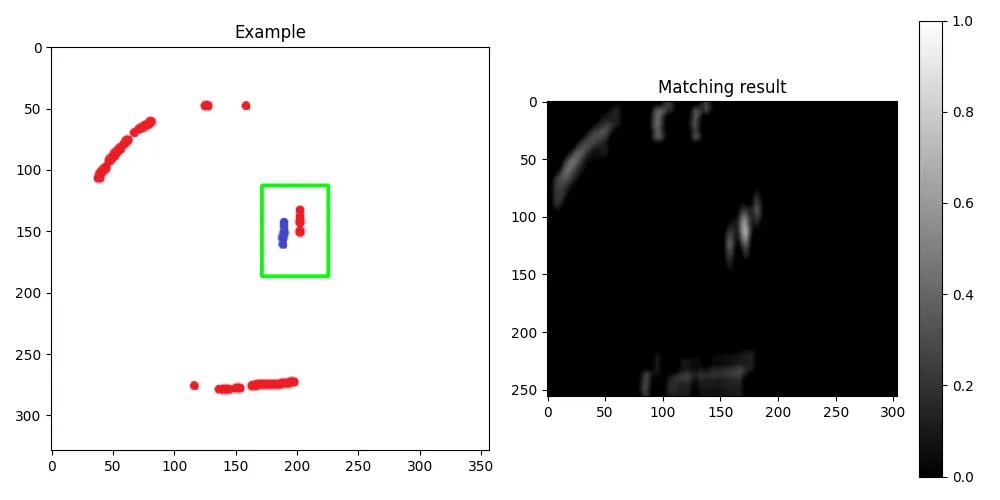
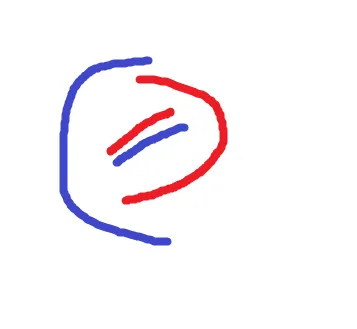
另一组示例:
这就是我要搜索的内容

我希望上面的图像与中间和底部的图像相似(注意:我将目标图像旋转45度并将其与下面的图像进行比较)
特征匹配(如下面的答案所述)对于找到第二个图像的相似性非常有用,但是对于第三个图像却没有用(即使将其正确旋转)