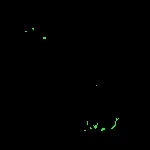
OpenCV - 获取所有 Blob 像素

5

我有这个图像:

enter image description here

我一直在使用功能SimpleBlobDetector来识别黑色背景上的白色像素块。以下是代码。
blobDetectorParameters = cv2.SimpleBlobDetector_Params()
blobDetectorParameters.filterByArea = True
blobDetectorParameters.minArea = 1
blobDetectorParameters.maxArea = 100
blobDetectorParameters.minDistBetweenBlobs = 1
blobDetectorParameters.filterByCircularity = False
blobDetectorParameters.filterByColor = False
blobDetectorParameters.filterByConvexity = False
blobDetectorParameters.filterByInertia = False

detector = cv2.SimpleBlobDetector_create(blobDetectorParameters)
keypoints = detector.detect(image)
imageWithKeypoints = cv2.drawKeypoints(image, keypoints, numpy.array([]), (0,0,255), cv2.DRAW_MATCHES_FLAGS_DRAW_RICH_KEYPOINTS)
cv2.imshow("Keypoints", imageWithKeypoints)
cv2.waitKey(0)  

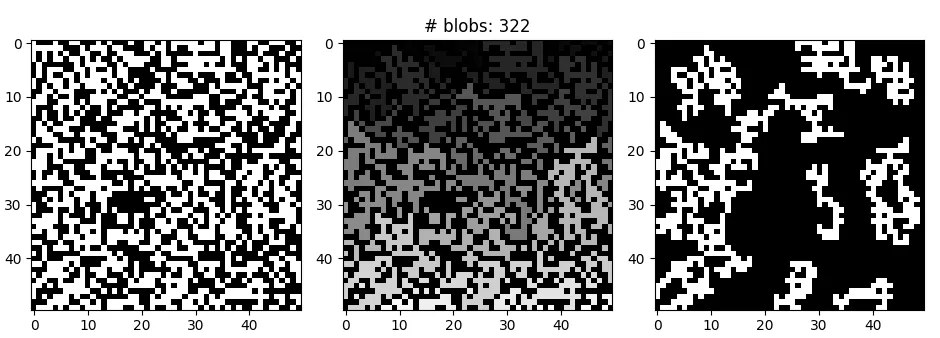
以下哪个选项正确地识别了下面图像中显示的斑点:

enter image description here

问题: 我希望能够有一个列出所有blob像素的列表,以便将它们涂成黑色。使用
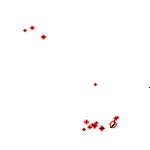
SimpleBlobDetector,我似乎找不到一种返回所有blob像素的方法。我可以得到关键点(通过detect返回),但我认为这些对应于blob中心。

我还应该补充说明,我只想涂出特定大小的blob,这就是抓取所有白色像素的普适方法不理想的原因。

是否有与SimpleBlobDetector(或OpenCV内部的其他地方)相关的函数来返回与所有blob相关的所有像素?

提前感谢您的帮助。


1
您可以使用矩来计算质心,然后绘制白色填充圆来覆盖它们。请参阅 https://www.learnopencv.com/find-center-of-blob-centroid-using-opencv-cpp-python/ 了解从矩到质心的计算。 - fmw42
@fmw42 我感谢您的建议,但我需要更精确地绘制画面,因为我不想将所有斑点都涂掉,只有特定大小的斑点。我需要这种方法能够识别并消除非常接近的斑点,但我不想意外遮挡任何不应该被涂掉的斑点。 - Antillies
使用nathancy下面的解决方案。 - fmw42
如果您可以使用skimage,它有一个很好的regionprops函数,可以返回二进制图像中blob的属性,包括面积、周长、质心等,对于您的情况来说,每个blob的坐标也非常重要。这使得过滤变得轻松! - Jon
3个回答

3
你可以使用 np.column_stack + np.where 在二进制图像上获取所有点的坐标。在这个例子中,我将每个点都染成了绿色,并放置在一个新的掩膜上。这是结果:

enter image description here

这里是每个像素的 (x,y) 坐标。
[[ 28  32]
 [ 28  33]
 [ 29  33]
 [ 31  25]
 [ 31  26]
 [ 37  43]
 [ 37  44]
 [ 37  45]
 [ 38  43]
 [ 38  44]
 [ 38  45]
 [ 85  96]
 [118 116]
 [118 118]
 [119 116]
 [119 117]
 [120 116]
 [121  87]
 [121 115]
 [122  87]
 [122 115]
 [123  87]
 [123  97]
 [123 115]
 [124  87]
 [124  97]
 [124 115]
 [125  93]
 [125  95]
 [125  96]
 [125 114]
 [125 115]
 [126  94]
 [126  95]
 [126  96]
 [126 113]
 [126 114]
 [127  90]
 [127  94]
 [127  95]
 [127  96]
 [127 112]
 [127 113]
 [128  90]
 [128  91]
 [128  95]
 [128 102]
 [128 103]
 [128 104]
 [128 111]
 [128 112]
 [129 101]
 [129 102]
 [129 103]
 [129 104]
 [130  84]
 [130  85]
 [130 101]
 [130 102]]

代码

import numpy as np 
import cv2

image = cv2.imread('1.png')
mask = np.zeros(image.shape, dtype=np.uint8)
gray = cv2.cvtColor(image, cv2.COLOR_BGR2GRAY)
thresh = cv2.threshold(gray, 0, 255, cv2.THRESH_BINARY + cv2.THRESH_OTSU)[1]

coords = np.column_stack(np.where(thresh > 0))
for coord in coords:
    mask[coord[0], coord[1]] = (36,255,12)

print(coords)
cv2.imshow('mask', mask)
cv2.waitKey()

更新:您可以使用轮廓面积过滤来实现所需的结果。具体而言,我们可以使用cv2.findContours()来获取所有斑点的轮廓,然后使用cv2.contourArea()对轮廓面积进行过滤。如果轮廓通过了一些最小阈值面积,则绘制它,否则忽略该轮廓。我们可以使用cv2.drawContours()绘制斑点,通过在最后一个参数传入-1,我们填充轮廓,否则任何正值都将绘制斑点的外轮廓。以下是一个示例:

import numpy as np 
import cv2

image = cv2.imread('1.png')
mask = np.zeros(image.shape, dtype=np.uint8)
gray = cv2.cvtColor(image, cv2.COLOR_BGR2GRAY)
thresh = cv2.threshold(gray, 0, 255, cv2.THRESH_BINARY + cv2.THRESH_OTSU)[1]

cnts = cv2.findContours(thresh, cv2.RETR_EXTERNAL, cv2.CHAIN_APPROX_SIMPLE)
cnts = cnts[0] if len(cnts) == 2 else cnts[1]
threshold_area = 0.5
for c in cnts:
    area = cv2.contourArea(c)
    if area > threshold_area:
        cv2.drawContours(mask, [c], -1, (36,255,12), -1)

cv2.imshow('mask', mask)
cv2.waitKey()

我非常感激您的回复,但是 - 我已经更新了原始帖子以反映这一点 - 我不想涂掉 所有 的斑块,只想涂掉特定大小的斑块。这就是为什么我希望能够从SimpleBlobDetector中获取斑块像素,而不是抓取所有白色像素的方法。 - Antillies
1
@Antillies 哦,我明白了,请查看更新。您可以使用 cv2.findContours() + cv2.contourArea() 根据某个阈值面积过滤斑点。如果斑点通过此筛选器,则我们可以使用 cv2.drawContours() 绘制斑点。 - nathancy
搞定了。我对你的代码唯一做出的更改是将threshold_area修改为min_threshold_area并添加了一个max_threshold_area比较器,将if语句改为if area > min_threshold_area and area < max_threshold_area。感谢你的所有帮助和见解。作为最后一个问题,我可以问一下这行代码的原因吗:cnts = cnts[0] if len(cnts) == 2 else cnts[1]。如果计数器等于2,为什么要获取返回的“图像”,而不是轮廓本身? - Antillies

1
我认为对于您的用例,您可能会从findContours中受益更多。您甚至会发现SimpleBlobDetector使用此函数。它在您提供的链接的第2步中提到,但请注意,轮廓仅列出外部像素。如果您所要做的只是简单地绘制每个斑点,则在使用drawContours时,您只需要将粗细参数设置为-1。
如果您需要知道每个像素值,则我会说解决方案是绘制每个轮廓,然后将像素值记录到您自己的列表中。不完全清楚您正在尝试使用这个来做什么,所以很难给您一个直接的答案,但我希望这可以帮助您。

1

可能有点晚,但我遇到了同样的问题。我想要过滤掉较小的 blob。所以我最终写出了以下代码:

def filter_blobs(bin_img, min_size):
    label_ix = 1
    labels = np.zeros(shape=bin_img.shape)
    for j, row in enumerate(bin_img):
        for i, pix in enumerate(row):
            if pix > 0:
                above = labels[j-1][i] if j > 0 else None
                left = labels[j][i-1] if i > 0 else None
                if above and above > 0:
                    labels[j][i] = above
                    if left and left > 0:
                        labels[labels==left] = above
                elif left and left > 0:
                    labels[j][i] = left
                else:
                    labels[j][i] = label_ix
                    label_ix += 1
    for label in range(1, label_ix+1):
        filt = labels == label
        size = np.sum(filt)
        if size < min_size:
            bin_img[filt] = 0
    return label_ix, labels/np.max(labels)*255, bin_img

bin_img = np.round(np.random.rand(50,50))*255
fig = plt.figure(figsize=(9.5,4))
ax = fig.add_subplot(1,3,1)
ax.imshow(bin_img, cmap='gray', vmin=0, vmax=255)
num_blobs, blob_img, filtered_img = filter_blobs(bin_img, 20)
ax = fig.add_subplot(1,3,2)
ax.imshow(blob_img, cmap='gray', vmin=0, vmax=255)
ax.set_title('# blobs: {}'.format(num_blobs))
ax = fig.add_subplot(1,3,3)
ax.imshow(filtered_img, cmap='gray', vmin=0, vmax=255)
plt.tight_layout()

这是一个输出的例子:

enter image description here

非常有趣的玩意。如果有人能让它更高效,请评论!


网页内容由stack overflow 提供, 点击上面的
可以查看英文原文,
原文链接