我想使用从三个点计算出的向量来绘制一个平面。
pointA = [0,0,0];
pointB = [-10,-20,10];
pointC = [10,20,10];

plane1 = cross(pointA-pointB, pointA-pointC)
我该如何在三维空间中绘制“plane1”?
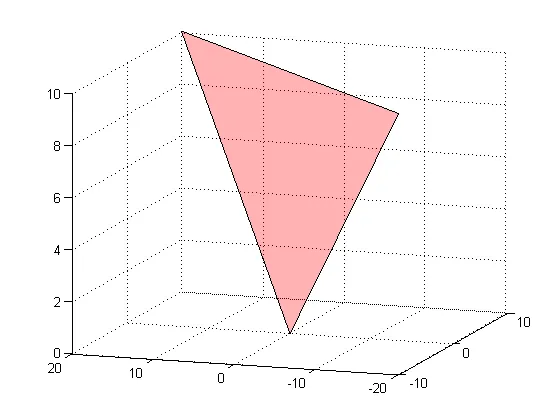
这是使用fill3绘制平面的简单方法:
points=[pointA' pointB' pointC']; % using the data given in the question
fill3(points(1,:),points(2,:),points(3,:),'r')
grid on
alpha(0.3)
fill3 接受 X,Y,Z 作为输入,而不是三个点。看一下你画的平面,它没有通过 (0,0,0)。你画了一个通过 (0,-10,10)、(0,-20,20) 和 (0,10,10) 的平面。 - Andrey Rubshteinfill3时犯了一个错误(使用了错误的维度),现在已经纠正了。感谢您的注意。我仍然认为一行代码比几行更好看... - bla您已经计算出法向量。现在,您应该确定您的平面在x和z上的限制,并创建一个矩形补丁。
解释:每个平面都可以用它的法向量(A,B,C)和另一个系数D来描述。平面的方程是AX+BY+CZ+D=0。两个点之间的差值的叉积cross(P3-P1,P2-P1)可用于找到(A,B,C)。为了找到D,只需将任何点放入上述方程中即可。
D = -Ax-By-Cz;
一旦您有了平面方程,您可以选择4个在该平面上的点,然后在它们之间绘制路径。
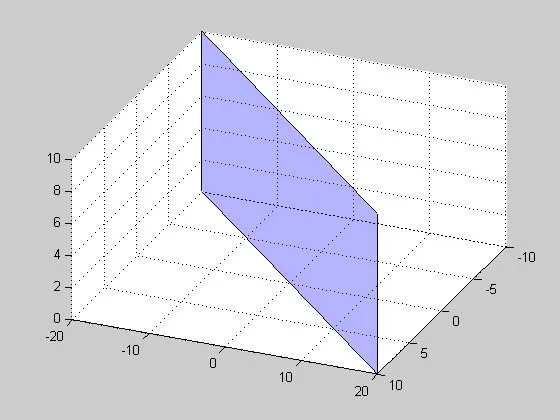
normal = cross(pointA-pointB, pointA-pointC); %# Calculate plane normal
%# Transform points to x,y,z
x = [pointA(1) pointB(1) pointC(1)];
y = [pointA(2) pointB(2) pointC(2)];
z = [pointA(3) pointB(3) pointC(3)];

%Find all coefficients of plane equation
A = normal(1); B = normal(2); C = normal(3);
D = -dot(normal,pointA);
%Decide on a suitable showing range
xLim = [min(x) max(x)];
zLim = [min(z) max(z)];
[X,Z] = meshgrid(xLim,zLim);
Y = (A * X + C * Z + D)/ (-B);
reOrder = [1 2  4 3];
figure();patch(X(reOrder),Y(reOrder),Z(reOrder),'b');
grid on;
alpha(0.3);
function [x, y, z] = plane_surf(normal, dist, size)

normal = normal / norm(normal);
center = normal * dist;

tangents = null(normal') * size;

res(1,1,:) = center + tangents * [-1;-1];
res(1,2,:) = center + tangents * [-1;1];
res(2,2,:) = center + tangents * [1;1];
res(2,1,:) = center + tangents * [1;-1];

x = squeeze(res(:,:,1));
y = squeeze(res(:,:,2));
z = squeeze(res(:,:,3));

end
您可以将其用作:
normal = cross(pointA-pointB, pointA-pointC);
dist = dot(normal, pointA)

[x, y, z] = plane_surf(normal, dist, 30);
surf(x, y, z);
在所讨论的平面上绘制一个边长为60的正方形
normal = cross(pointA-pointB, pointA-pointC);
x = [pointA(1) pointB(1) pointC(1)];
y = [pointA(2) pointB(2) pointC(2)];
z = [pointA(3) pointB(3) pointC(3)];
A = normal(1); B = normal(2); C = normal(3);
D = -dot(normal,pointA);
zLim = [min(z) max(z)];
yLim = [min(y) max(y)];
[Y,Z] = meshgrid(yLim,zLim);
X = (C * Z + B * Y + D)/ (-A);
reOrder = [1 2  4 3];
figure();patch(X(reOrder),Y(reOrder),Z(reOrder),'r');
grid on;
alpha(0.3);
当C不为0时,以下代码有效
normal = cross(pointA-pointB, pointA-pointC);
x = [pointA(1) pointB(1) pointC(1)];
y = [pointA(2) pointB(2) pointC(2)];
z = [pointA(3) pointB(3) pointC(3)];
A = normal(1); B = normal(2); C = normal(3);
D = -dot(normal,pointA);
xLim = [min(x) max(x)];
yLim = [min(y) max(y)];
[Y,X] = meshgrid(yLim,xLim);
Z = (A * X + B * Y + D)/ (-C);
reOrder = [1 2  4 3];
figure();patch(X(reOrder),Y(reOrder),Z(reOrder),'r');
grid on;
alpha(0.3);
surf或类似的函数绘制这些点... - Isaac