我想用小波变换去噪信号,但一些数据在降噪后并没有显著的改变。
代码:
智能鞋垫情节: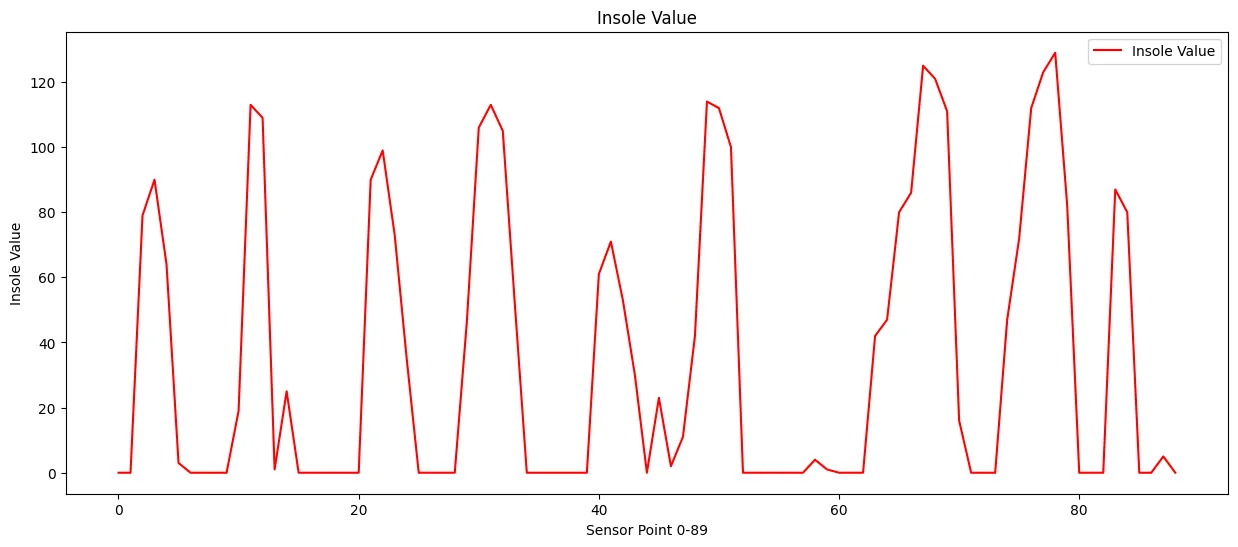
代码:
df = pd.read_csv('0311LalaStand5Min1.csv', low_memory=False)
columns = ['Fx','Fy','Fz','Mx','My','Mz']
selected_df = df[columns]
FPDatas = selected_df[:15000]

FPData = np.array(FPDatas).astype('float64')

wavelet = 'db4'

# Perform the wavelet decomposition
coeffs = pywt.wavedec2(FPData, wavelet)

# Threshold the coefficients (using hard thresholding)
threshold = 0.1# adjust this threshold to control the amount of noise removal
coeffs_thresh = [pywt.threshold(c, threshold, 'soft') for c in coeffs]

# Reconstruct the signal using the inverse wavelet transform
FPData_Decompos = pywt.waverec2(coeffs_thresh, wavelet)

plt.figure(figsize=(15,6))
    # plt.figure()
plt.plot(FPData[:,1],color='red')
plt.plot(FPData_Decompos[:,1], markerfacecolor='none',color='green')
plt.legend(['Real Data', 'Denoising Data'], loc='best')
plt.show()
结果:
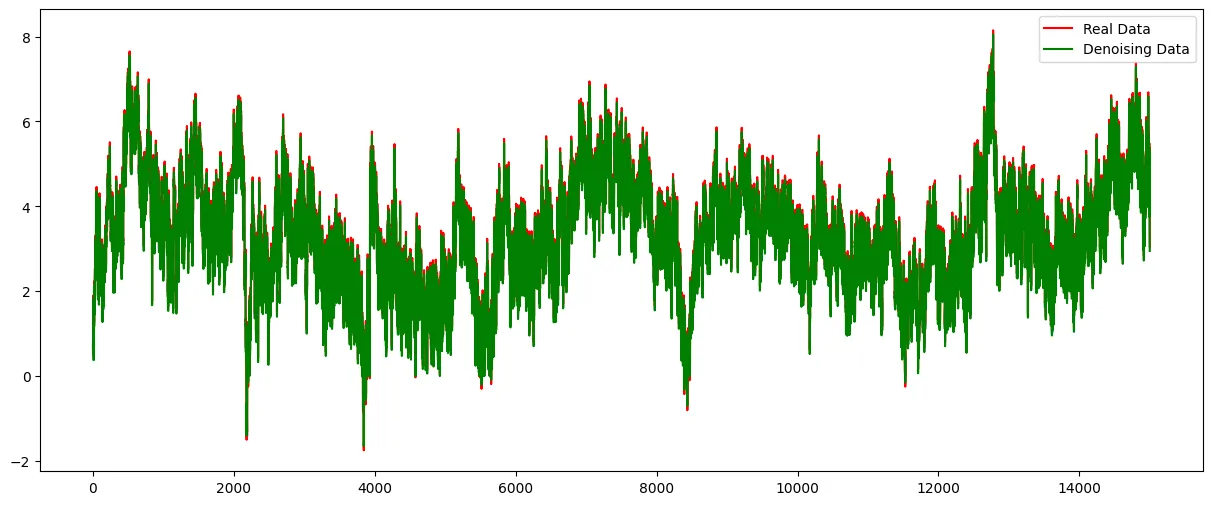
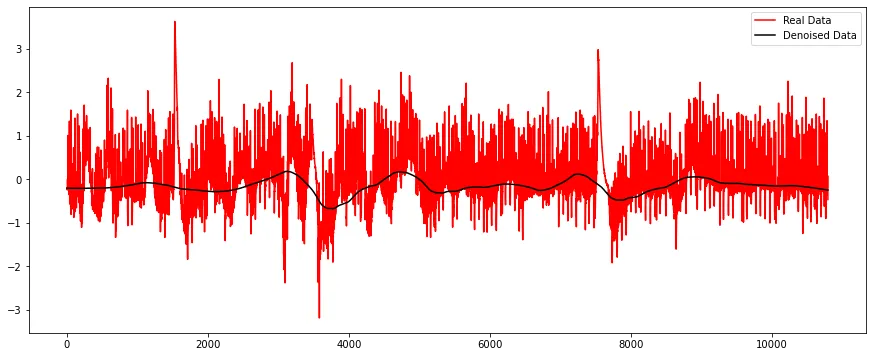
我已经调整了阈值,但仍然相同。去噪数据没有平滑。
数据集链接:https://drive.google.com/file/d/1hV0kWe_C0XUZWY-M6hh8UC8RtO9Q521b/view?usp=sharing
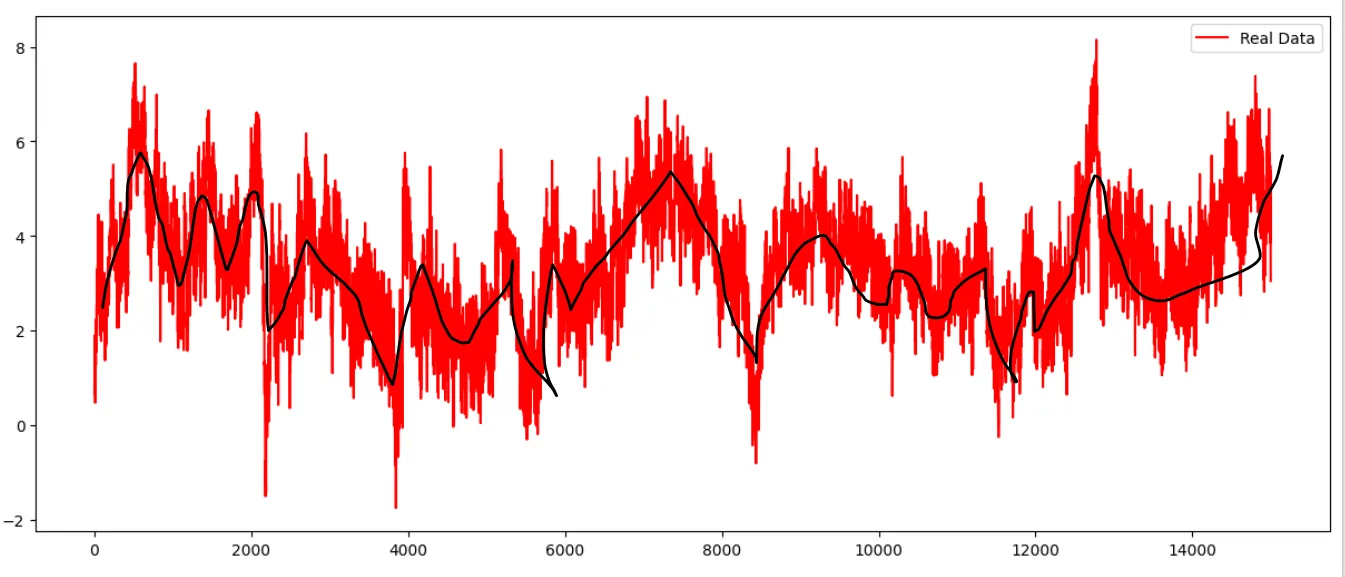
期望的结果与下面的黑点相同:
第二种情况:
SmartInsole = np.array([[  0.,   0.,  79.,  90.,  64.,   3.,   0.,   0.,   0.,   0.,  19.,
        113., 109.,   1.,  25.,   0.,   0.,   0.,   0.,   0.,   0.,  90.,
         99.,  73.,  35.,   0.,   0.,   0.,   0.,  46., 106., 113., 105.,
         52.,   0.,   0.,   0.,   0.,   0.,   0.,  61.,  71.,  53.,  30.,
          0.,  23.,   2.,  11.,  42., 114., 112., 100.,   0.,   0.,   0.,
          0.,   0.,   0.,   4.,   1.,   0.,   0.,   0.,  42.,  47.,  80.,
         86., 125., 121., 111.,  16.,   0.,   0.,   0.,  47.,  72., 112.,
        123., 129.,  82.,   0.,   0.,   0.,  87.,  80.,   0.,   0.,   5.,
          0.],
       [  0.,   0.,  79.,  90.,  64.,   3.,   0.,   0.,   0.,   0.,  19.,
        113., 109.,   1.,  25.,   0.,   0.,   0.,   0.,   0.,   0.,  90.,
         99.,  73.,  35.,   0.,   0.,   0.,   0.,  46., 106., 113., 105.,
         52.,   0.,   0.,   0.,   0.,   0.,   0.,  57.,  68.,  47.,  20.,
          0.,  17.,   1.,  14.,  48., 120., 118., 105.,   0.,   0.,   0.,
          0.,   0.,   0.,   4.,   1.,   0.,   0.,   0.,  42.,  47.,  80.,
         86., 125., 121., 111.,  16.,   0.,   0.,   0.,  47.,  72., 112.,
        123., 129.,  82.,   0.,   0.,   0.,  87.,  80.,   0.,   0.,   5.,
          0.]])

How to implemet above technique to remove noise if the SmartInsole data like above.
智能鞋垫情节: