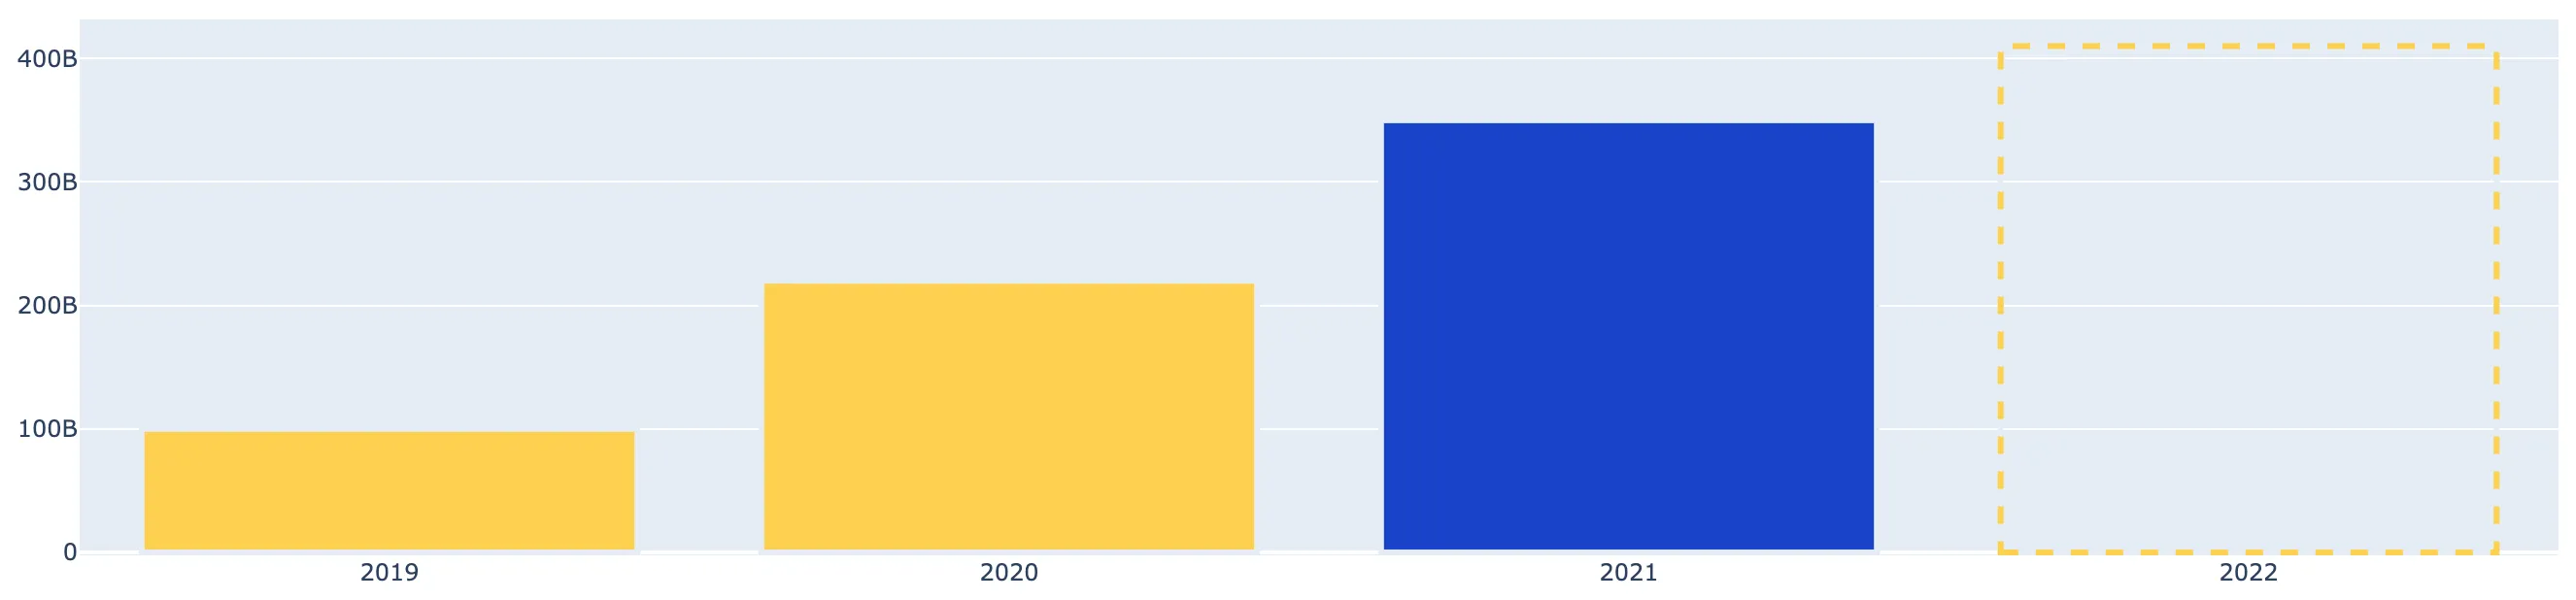
我正在尝试创建一个条形图,如下图所示:
 我已经接近成功,但是没有找到有关设置虚线或点线边框样式的参考资料;
下面是我创建的图表图片: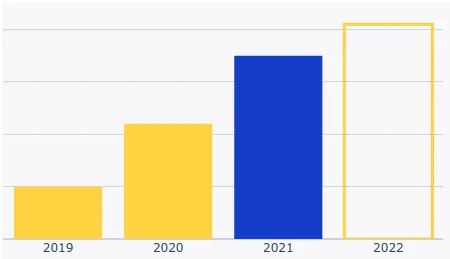
我将在下面添加一个最简可复现的代码:
任何有关如何实现这个问题的参考或帮助都会非常感激;
谢谢大家提前, 问候, Leonardo
我已经接近成功,但是没有找到有关设置虚线或点线边框样式的参考资料;下面是我创建的图表图片:
我将在下面添加一个最简可复现的代码:
import plotly.graph_objects as go

data={"years":[2019,2020,2021,2022],
      "total_value":[100000000000,220000000000,350000000000,410000000000]}

def bar_styled(data):

    blank = 'rgba(0,0,0,0)'
    colors =["#FED241", "#FED241", "#143DCB", blank]

    fig = go.Figure(data=[go.Bar(
        x=data['years'],
        y=data['total_value'],
        marker_color=colors, # marker color can be a single color value or an iterable
        marker_line_width=3
    )])

    fig.update_layout(title_text=None, paper_bgcolor=blank,
                      height=300, margin={"b":4, "t":4, "l":8, "r":8 })

    color_list=fig.data[0]["marker"]["color"]

    fig.data[0]["marker"]['line']["color"]=['#FED241' if val == blank else  blank for val in color_list]

    fig.update_xaxes(type='category')

    return fig

bar_styled(data)
任何有关如何实现这个问题的参考或帮助都会非常感激;
谢谢大家提前, 问候, Leonardo