如何在Bokeh中使用自定义标签来表示刻度?

23

我知道你可以在 Bokeh 中指定特定的刻度值,但我的问题是是否有一种方法可以将特定的标签与位置对应显示。例如:

plot.xaxis[0].ticker=FixedTicker(ticks=[0,1])

只会在0和1处显示x轴标签,但如果我想显示苹果和橙子而不是0和1怎么办。类似于:

将标签设置为 "0": "Apple" 和 "1": "Orange"

将标签设置为 "0": "Apple" 和 "1": "Orange"
plot.xaxis[0].ticker=FixedTicker(ticks=[0,1], labels=['Apple', 'Orange'])

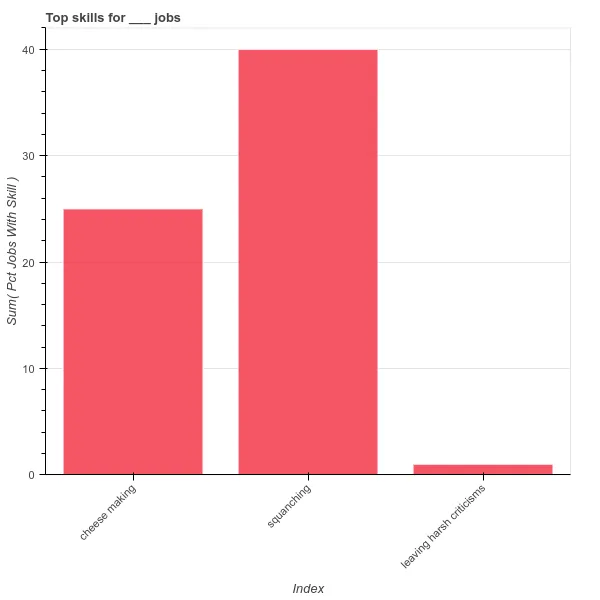
我绘制的数据无法使用直方图呈现。在 Bokeh 中是否有任何方法可以如此自定义标签?

4个回答

29
固定的刻度可以直接作为“ticker”值传递,可以提供主要标签覆盖来明确地提供特定值的自定义标签:
from bokeh.plotting import figure, output_file, show
    
p = figure()
p.circle(x=[1,2,3], y=[4,6,5], size=20)
    
p.xaxis.ticker = [1, 2, 3]
p.xaxis.major_label_overrides = {1: 'A', 2: 'B', 3: 'C'}
    
output_file("test.html")
    
show(p)

enter image description here


看起来很有用,但在我的浏览器上只是显示一个空白页面。 - EddyTheB
1
在我的环境中,使用 Bokeh 0.12.40.12.5 都能正常工作,因此需要更多信息来调查可能的原因。 - bigreddot
1
我之前使用的是0.12.2版本,升级后问题得到了解决 :-) - EddyTheB

7

编辑:已更新为Bokeh0.12.5,但也请参见其他答案中更简单的方法。

这对我有用:

import pandas as pd
from bokeh.charts import Bar, output_file, show
from bokeh.models import TickFormatter
from bokeh.core.properties import Dict, Int, String

class FixedTickFormatter(TickFormatter):
    """
    Class used to allow custom axis tick labels on a bokeh chart
    Extends bokeh.model.formatters.TickFormatte
    """

    JS_CODE =  """
        import {Model} from "model"
        import * as p from "core/properties"

        export class FixedTickFormatter extends Model
          type: 'FixedTickFormatter'
          doFormat: (ticks) ->
            labels = @get("labels")
            return (labels[tick] ? "" for tick in ticks)
          @define {
            labels: [ p.Any ]
          }
    """

    labels = Dict(Int, String, help="""
    A mapping of integer ticks values to their labels.
    """)

    __implementation__ = JS_CODE

skills_list = ['cheese making', 'squanching', 'leaving harsh criticisms']
pct_counts = [25, 40, 1]
df = pd.DataFrame({'skill':skills_list, 'pct jobs with skill':pct_counts})
p = Bar(df, 'index', values='pct jobs with skill', title="Top skills for ___ jobs", legend=False)
label_dict = {}
for i, s in enumerate(skills_list):
    label_dict[i] = s

p.xaxis[0].formatter = FixedTickFormatter(labels=label_dict)
output_file("bar.html")
show(p)

result of code


创建了技能列表和百分比计数,但这里没有显示出来。这对任何人有什么好处吗??? - dopatraman
1
哈,那就是你为什么投下了反对票的原因?你本可以编辑代码并提出建设性意见的。 - wordsforthewise
我想帮忙,但还是不行。生成的JS找不到“FixedTickFormatter”。 - dopatraman
这不太合理,因为数组应该是3个数字。Python2还是3?Pandas的哪个版本? - wordsforthewise
1
在Python 3.6和bokeh 0.12.5上运行良好。 - addoil
显示剩余2条评论

0

这可以被视为分类数据,参见bokeh文档

from bokeh.plotting import figure, show

categories = ['A', 'B','C' ]

p = figure(x_range=categories)
p.circle(x=categories, y=[4, 6, 5], size=20)

show(p)

enter image description here


0
不落在十的倍数上的x轴刻度标签可能不可见。这可能是由于数据点不准确或以某种方式被操纵的结果。如果发生这种情况,
在bokeh 3.1.1上进行修改,使用填充来扩展十的倍数的刻度标签。我的图表x轴范围为50,y轴范围为25,最小高度为800,最小宽度为1600。
请参见下方-
    label_dict = { 0: "g (1-7)", 1: "", 2: "", 3: "", 4: "", 5: "", 6: "", 7: "", 8: "", 9: "", 10: "O (8-13)", 11: "", 12: "", 13: "", 14: "", 15: "", 16: "", 17: "", 18: "", 19: "", 20: "E (14-18)            I (19-24)", 21: "", 22: "", 23: "", 24: "", 25: "", 26: "", 27: "", 28: "", 29: "", 30: "C (25-35)                ", 31: "", 32: "", 33: "", 34: "", 35: "", 36: "", 37: "", 38: "", 39: "", 40: "λ(36) k(37)      A / L (38-40)", 41: "", 42: "", 43: "", 44: "", 45: "", 46: "", 47: "", 48: "", 49: ""}

    fig.xaxis.major_label_overrides = label_dict

See label at point x=20. Image truncated for simplicity


网页内容由stack overflow 提供, 点击上面的
可以查看英文原文,
原文链接