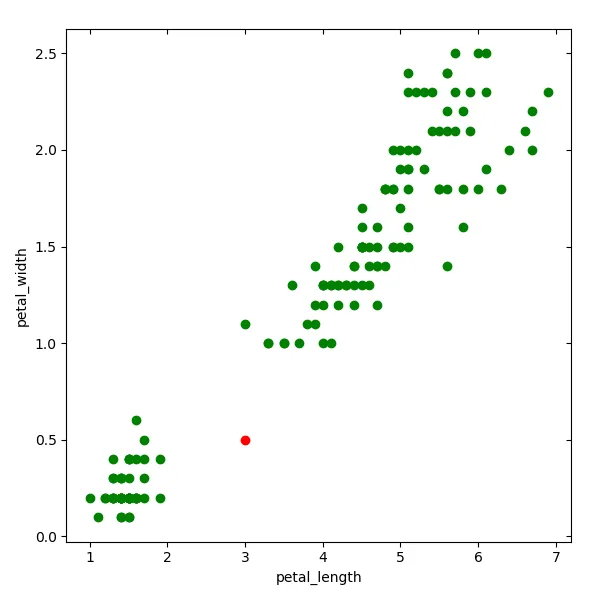
使用seaborn,我如何在散点图中添加不同颜色的数据点或更改最后一个数据点的颜色?

6
import seaborn as sns
iris = sns.load_dataset("iris")    
grid = sns.JointGrid(iris.petal_length, iris.petal_width, space=0, size=6, ratio=50)
    grid.plot_joint(plt.scatter, color="g")

上面的代码将基于鸢尾花数据集创建散点图。我想在[3,.05]处添加另一个数据点,它将是红色的;或者将数据集中的最后一个点变为红色。我该怎么做?

My current Image

1个回答

8

在自定义的xy坐标上添加一个点,请使用您的坐标添加matplotlib.pyplot.scatter

plt.scatter(x=3, y=0.5, color='r')

为了强调您的最后一点,并在数据上使用 .iloc 定位器:

plt.scatter(iris.petal_length.iloc[-1], iris.petal_width.iloc[-1], color='r')
注意iloc 定位器来自于 pandas,而 plt.scatter 来自于 matplotlib.pyplot。这两者都是 seaborn 的必需依赖项,因此如果您使用 seaborn,则一定已经在电脑上安装了它们。
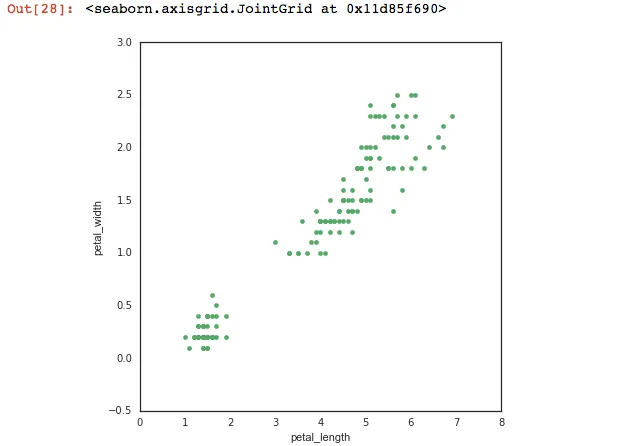
例如:

import seaborn as sns
import matplotlib.pyplot as plt
iris = sns.load_dataset("iris")    
grid = sns.JointGrid(iris.petal_length, iris.petal_width, space=0, size=6, ratio=50)
grid.plot_joint(plt.scatter, color="g")
# add your point
plt.scatter(x=3, y=0.5, color='r')
# or
# plt.scatter(iris.petal_length.iloc[-1], iris.petal_width.iloc[-1], color='r')

enter image description here


我使用以下代码添加边际图:“grid.plot_marginals(sns.distplot, kde=False, color=".5")”。如何在分布图中用蓝色线标记x、y的最后一个数据点? - JOR_1974
关于distplot的线条,我建议您提出一个单独的问题,因为我并没有立刻想到答案,而且这是一个不同的问题。 - sacuL

网页内容由stack overflow 提供, 点击上面的
可以查看英文原文,
原文链接