我正在尝试以自动生成的流程图形式定位表单中的元素。一般来说,
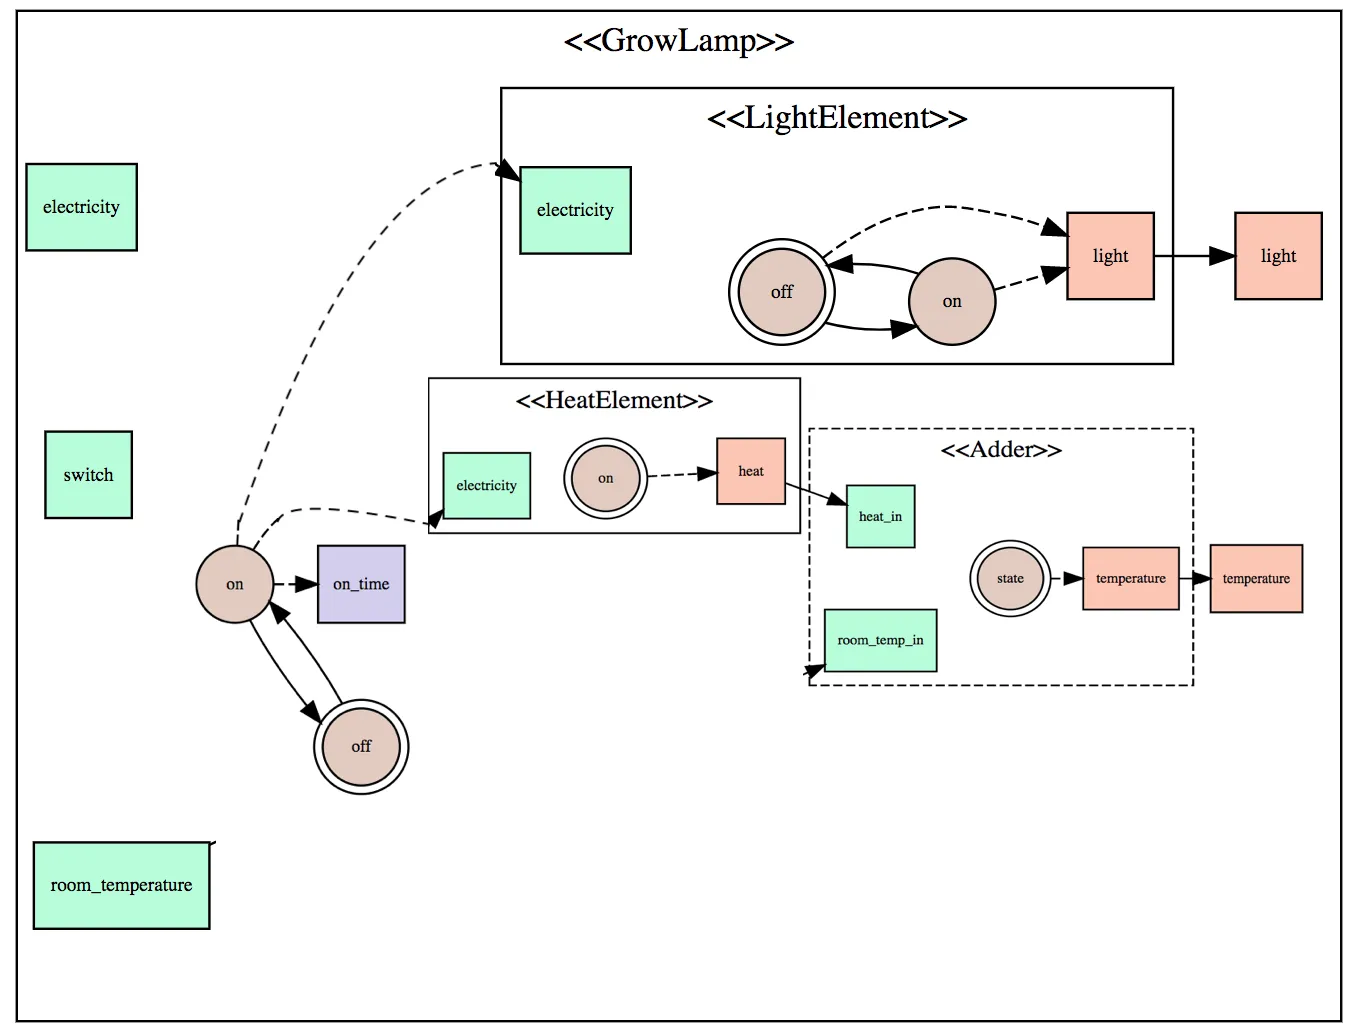
然而,当我开始嵌套图形时,
有没有一种方法可以指定“rank=center”(或类似的东西)?
我已经阅读了文档,但没有找到正确的属性(以及在哪里指定它们)。
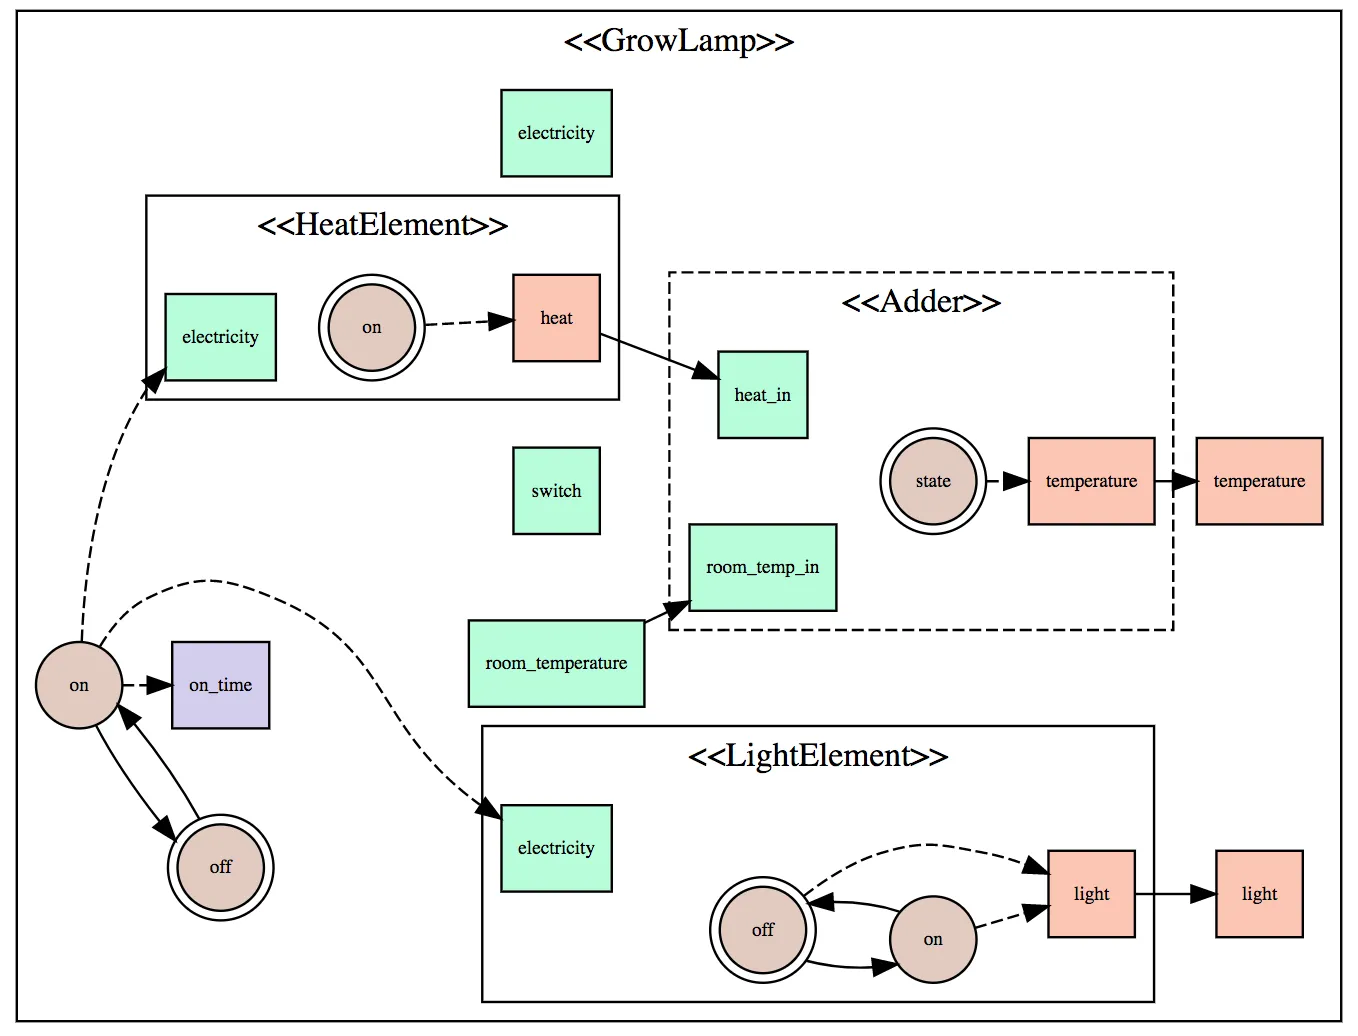
inputs(绿色)应该在最左边,outputs(红色)应该在最右边,其余内容应根据布局放置在中心。我使用rank=source和rank=sink来实现这一点。在标准图内部,它运行得很好。然而,当我开始嵌套图形时,
rank=source似乎不起作用。我期望<>(电力、开关、室温)的三个输入被放置在最左边(因为在子图中就是这样),而子图+状态(棕色圆圈)和输入输出之间的蓝色框则在中间。有没有一种方法可以指定“rank=center”(或类似的东西)?
我已经阅读了文档,但没有找到正确的属性(以及在哪里指定它们)。
digraph MyGraph {
    node [fontsize=8  margin=".1,.01" width=.5 height=.5 shape=box]
    edge [fontsize=8]
    rankdir=LR;
    ranksep = .25;
    nodesep= .5;

subgraph cluster_4386357488 {
    label = " <<GrowLamp>>"
    style=solid
    {rank=source;
        4386357544 [label="electricity" style=filled fillcolor="#b5fed9"]
        4386357712 [label="room_temperature" style=filled fillcolor="#b5fed9"]
        4386357768 [label="switch" style=filled fillcolor="#b5fed9"]
    }
    {
        4386357880 [label="off" style=filled fillcolor="#e2cbc1" shape=doublecircle]
        4386357936 [label="on" style=filled fillcolor="#e2cbc1" shape=circle]
        4386357656 [label="on_time" style=filled fillcolor="#d2ceef"]
    }
    {rank=sink;
        4386357600 [label="light" style=filled fillcolor="#fcc5b3"]
        4386357824 [label="temperature" style=filled fillcolor="#fcc5b3"]
    }
    4386357880 -> 4386357936
    4386357936 -> 4386357880
    {
        subgraph cluster_4386357992 {
            label = "<<Adder>>"
            style=dashed
            {rank=source;
                4386358048 [label="heat_in" style=filled fillcolor="#b5fed9"]
                4386358104 [label="room_temp_in" style=filled fillcolor="#b5fed9"]
            }
            {
                4386358216 [label="state" style=filled fillcolor="#e2cbc1" shape=doublecircle]
            }
            {rank=sink;
                4386358160 [label="temperature" style=filled fillcolor="#fcc5b3"]
            }
            4386358216 -> 4386358160 [style="dashed"]
        }


        subgraph cluster_4386358328 {
            label = "<<HeatElement>>"
            style=solid
            {rank=source;
                4386358384 [label="electricity" style=filled fillcolor="#b5fed9"]
            }
            {
                4386358496 [label="on" style=filled fillcolor="#e2cbc1" shape=doublecircle]
            }
            {rank=sink;
                4386358440 [label="heat" style=filled fillcolor="#fcc5b3"]
            }
            4386358496 -> 4386358440 [style="dashed"]
        }


        subgraph cluster_4386358608 {
            label = "<<LightElement>>"
            style=solid
            {rank=source;
                4386358664 [label="electricity" style=filled fillcolor="#b5fed9"]
            }
            {
                4386358776 [label="off" style=filled fillcolor="#e2cbc1" shape=doublecircle]
                4386358832 [label="on" style=filled fillcolor="#e2cbc1" shape=circle]
            }
            {rank=sink;
                4386358720 [label="light" style=filled fillcolor="#fcc5b3"]
            }
            4386358776 -> 4386358832
            4386358832 -> 4386358776
            4386358776 -> 4386358720 [style="dashed"]
            4386358832 -> 4386358720 [style="dashed"]
        }

        4386358160 -> 4386357824
        4386357712 -> 4386358104
        4386358440 -> 4386358048
        4386358720 -> 4386357600
        4386357936 -> 4386358384 [style="dashed"]
        4386357936 -> 4386358664 [style="dashed"]
        4386357936 -> 4386357656 [style="dashed"]
    }

}
希望的解决方案: 以下是我想要实现的目标。请注意,绿色框均位于各自子图的左侧,红色框位于右侧。它们之间应该是由graphviz定位的其他元素。
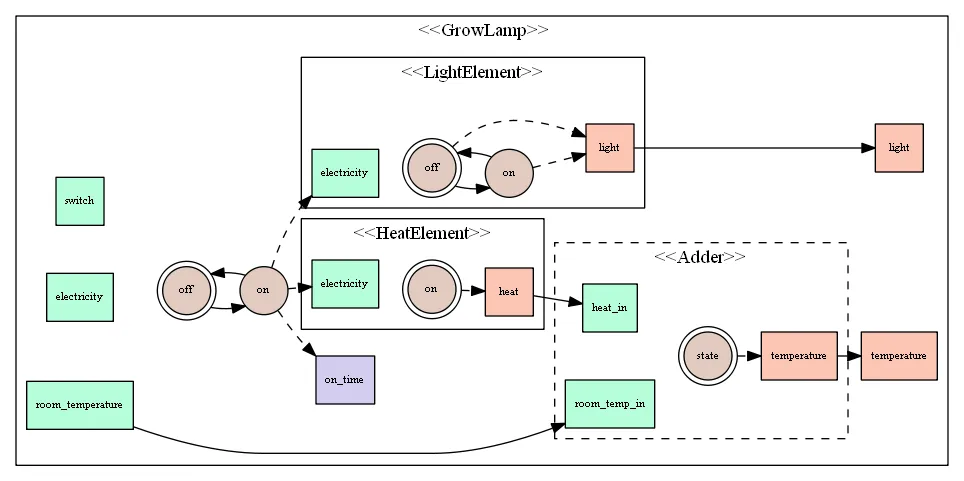
dot自行处理)。因此应该有一种从左到右的“流动”。 - stklik