我正在使用Python中的seaborn软件包绘制热力图。 我要绘制的值是离散的,它们是整数-1,0和1。
我希望带有值-1的单元格显示为绿色,带有0的单元格显示为黄色,1的单元格显示为红色。
在cubehelix_palette()或color_palette()函数中是否可以指定这种规则?
matplotlib.colors.ListedColormap:import numpy as np
import seaborn as sns
from matplotlib.colors import ListedColormap
data = np.random.randint(-1, 2, (10,10)) # Random [-1, 0, 1] data
sns.heatmap(data, cmap=ListedColormap(['green', 'yellow', 'red']), annot=True)
它产生以下结果:
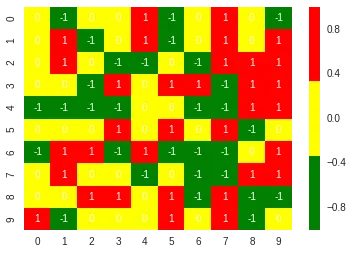
您可以将字符串'green','yellow','red'替换为十六进制颜色,例如'#FF0000'(相当于'red'),或RGB颜色,例如(1.,0.,0.)(也等同于'red')。