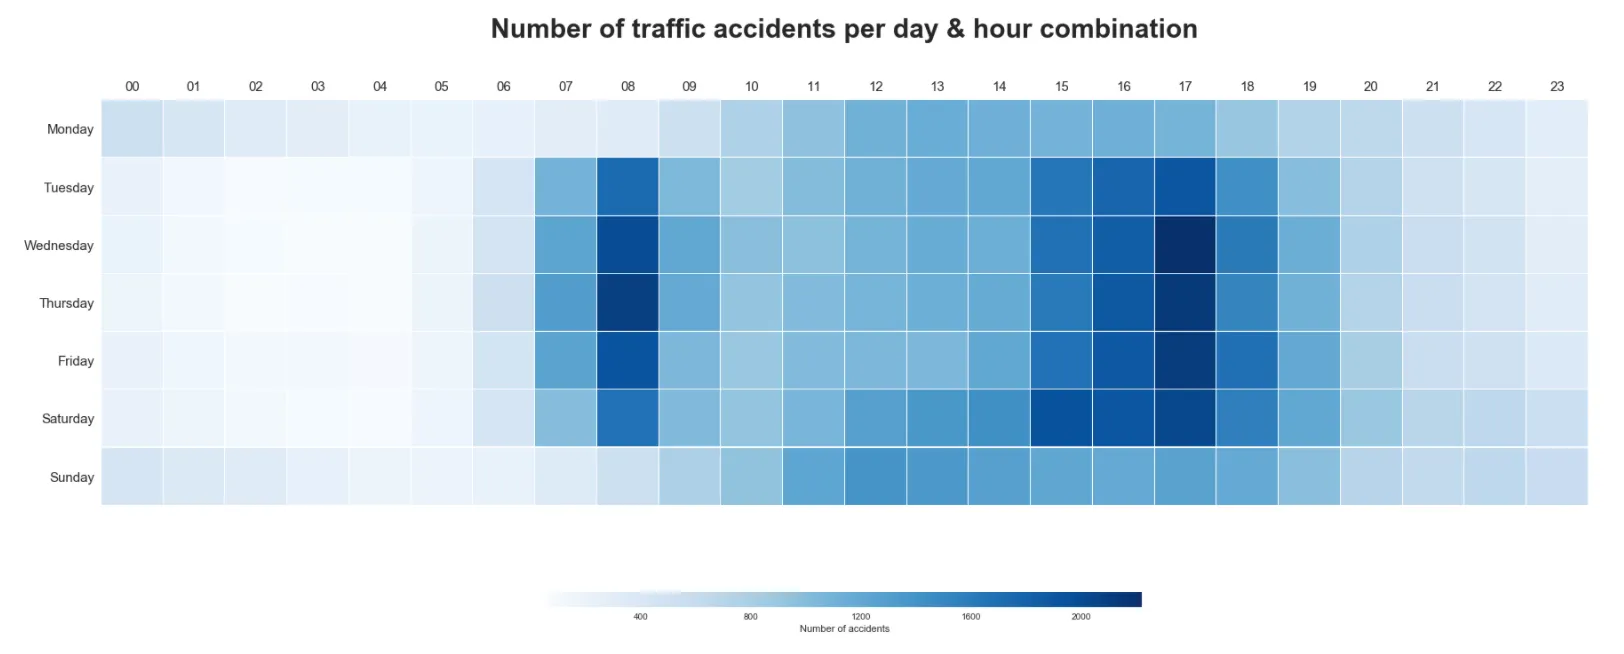
我在 Seaborn 中制作了一个热力图,并有相应的水平颜色条。我已经为颜色条添加了标题,但实际上这个标题出现在颜色条下方,而我希望它出现在上方。是否有一些方法可以更改这个问题?并且是否能够更改标题的字体大小以及颜色条标签的大小?
fig, ax = plt.subplots(figsize=(30,12))
graph = sns.heatmap(df_pivot, cmap="Blues", linecolor="white", linewidths=0.1,
            cbar_kws={"orientation": "horizontal", "shrink":0.40, "aspect":40, "label": "Number of accidents"})


ax.set_title("Number of traffic accidents per day & hour combination",
fontsize=30, fontweight="bold")

from matplotlib import rcParams
rcParams['axes.titlepad'] = 70 # Space between the title and graph

locs, labels = plt.yticks() # Rotating row labels
plt.setp(labels, rotation=0) # Rotating row labels

ax.xaxis.tick_top() # x axis on top
ax.xaxis.set_label_position('top')

graph.tick_params(axis='both',labelsize=15) # Tick label size
graph
目前看起来是这个样子的。我希望“事故数量”标题在色条上方,但在热图下方。我希望色条与热图同宽。
ax的标题命名为ax,而不是cbar_ax。 - Serenity