如何在线条尺寸改变的情况下保持线型间距恒定

10

我一直在尝试使用ggplot2或grid绘制线条,使线段之间的间距相等,即使大小不同。然而,我一直没有成功,所以我向您寻求帮助。

在下面的示例中,当线条大小不同时,如何保持线段之间的绝对间距相等?

我想避免自己制作自定义makeContent.myclass方法来控制这个问题。

library(ggplot2)
library(grid)

df <- data.frame(
  x = c(1:2, 1:2),
  y = c(1:2, 2:1),
  size = c(1,1,10,10)
)

# In ggplot2
ggplot(df, aes(x, y, size = size, group = size)) +
  geom_line(linetype = 2)

# In grid
lines <- polylineGrob(
  x = scales::rescale(df$x), 
  y = scales::rescale(df$y), 
  id = c(1,1,2,2),
  gp = gpar(lty = 2, lwd = c(1, 10))
)

grid.newpage(); grid.draw(lines)

我希望能在Illustrator中制作类似以下内容的图形。请注意,红线段长度相等。

enter image description here

有什么想法吗?谢谢阅读!


2
没有仔细查看,但这可能会有所帮助:https://dev59.com/1FQJ5IYBdhLWcg3w5KCJ - user20650
1
是的,阅读这篇文章确实很有帮助,谢谢。以下是一些要点,以防太长没看完:(1)图形设备增加了不可预测性的层次。(2)对于2的幂线宽(2、4、8、16等),它似乎工作得非常好,但也仅限于2的幂。在我试图解决的整体问题中,这将过于受限制。 - teunbrand
这里有一个后续问题:https://dev59.com/Abzpa4cB1Zd3GeqPJmPn - teunbrand
2个回答

6

Teunbrand可能并不需要这个,但我想你可以将你的线转换为沿着线均匀间隔的一系列细长的多边形(polygonGrobs)。

该函数接受一系列x和y坐标,并返回一个虚线(作为单个treeGrob)。与您的示例一样,它以归一化npc坐标返回。您可以完全控制线宽、虚线长度和中断长度(但不是模式),以及颜色。恐怕单位有点任意,并且远非生产标准,但它相当有效:

segmentify <- function(x, y, linewidth = 1, dash_len = 1, 
                       break_len = 1, col = "black")
{
  
  linewidth <- 0.002 * linewidth
  dash_len  <- 0.01  * dash_len
  break_len <- 0.04  * break_len

  if(length(y) != length(x)) 
    stop("x and y must be the same length")
  if(!is.numeric(x) | !is.numeric(y))
    stop("x and y must be numeric vectors")
  if(length(x) < 2)
    stop("Insufficient x, y pairs to make line.")
  
  x <- scales::rescale(x)
  y <- scales::rescale(y)
  
  n_dashes <- 0
  skip_len <- break_len + dash_len
  
   df <- list()
  for(i in seq_along(x)[-1])
  {
    x_diff          <- x[i] - x[i - 1]
    y_diff          <- y[i] - y[i - 1]
    seg_len         <- sqrt(x_diff^2 + y_diff^2)
    seg_prop        <- skip_len / seg_len
    dist_from_start <- n_dashes * skip_len
    prop_start      <- dist_from_start/seg_len
    x_start         <- x[i-1] + prop_start * x_diff
    y_len           <- y_diff * seg_prop
    x_len           <- x_diff * seg_prop
    y_start         <- y[i-1] + prop_start * y_diff
    n_breaks        <- (seg_len - dist_from_start)/skip_len
    n_dashes        <- (n_dashes + n_breaks) %% 1
    n_breaks        <- floor(n_breaks)
    
    if(n_breaks)
    {
       df[[length( df) + 1]] <- data.frame(
        x = seq(x_start, x[i], by = x_len),
        y = seq(y_start, y[i], by = y_len)
        )
       df[[length( df)]]$theta <-
        atan(rep(y_diff/x_diff, length( df[[length( df)]]$x)))
    }
  }
  
   df <- do.call(rbind,  df)
   df$x1 <-  df$x + sin( df$theta) * linewidth + cos(df$theta) * dash_len
   df$x2 <-  df$x + sin( df$theta) * linewidth - cos(df$theta) * dash_len
   df$x3 <-  df$x - sin( df$theta) * linewidth - cos(df$theta) * dash_len
   df$x4 <-  df$x - sin( df$theta) * linewidth + cos(df$theta) * dash_len
   
   df$y1 <-  df$y - cos( df$theta) * linewidth + sin(df$theta) * dash_len
   df$y2 <-  df$y - cos( df$theta) * linewidth - sin(df$theta) * dash_len
   df$y3 <-  df$y + cos( df$theta) * linewidth - sin(df$theta) * dash_len
   df$y4 <-  df$y + cos( df$theta) * linewidth + sin(df$theta) * dash_len
  
   do.call(grid::grobTree, lapply(seq(nrow(df)), function(i) {
    grid::polygonGrob(c(df$x1[i], df$x2[i], df$x3[i], df$x4[i]), 
                      c(df$y1[i], df$y2[i], df$y3[i], df$y4[i]),
              gp = gpar(col = "#00000000", lwd = 0, fill = col))
   }))

}

这很简单易用:

set.seed(2)

x <- 1:10
y <- rnorm(10)

grid::grid.newpage()
grid::grid.draw(segmentify(x, y))

在这里输入图片描述

而只改变线条宽度而不影响间距,就像这样:

grid::grid.newpage()
grid::grid.draw(segmentify(x, y, linewidth = 3))

在此输入图片描述

您可以像这样控制间距和颜色:

grid::grid.newpage()
grid::grid.draw(segmentify(x, y, linewidth = 2, break_len = 0.5, col = "forestgreen"))

enter image description here


1
谢谢Allan,这是一个非常出色的答案,我真的很感激你为此付出了所有的努力。我会稍微试试并看看这个如何工作! - teunbrand

6

好的,受到Allan的鼓励,我决定尝试着自己画这个东西,这与我在这个问题中试图避免的事情相同,但对于你们其他人可能会有所帮助。

我的方法略有不同,主要区别在于(1)我们保留折线而不是转换为多边形;(2)我不太熟悉三角函数,所以我使用了approxfun()来插值线条;(3)我们将使用绝对单位而不是相对单位,这样当设备调整大小时就不会很尴尬。

首先,由于我打算将其用于自定义geom函数中,因此我旨在创建一个grob结构,以便轻松粘贴到geom的绘制方法的末尾。您可以给它一个grob,或者给出一个grob的参数。它会更改grob的类,这将在后面变得相关,删除linetype参数并添加虚线和断点的信息。

library(grid)
library(scales)

linetypeGrob <- function(x, ..., dashes = 1, breaks = 1) {
  if (!inherits(x, "polyline")) {
    x <- polylineGrob(x, ...)
  }
  class(x)[[1]] <- "linetypeGrob"
  x$gp$lty <- NULL
  x$dashes <- dashes
  x$breaks <- breaks
  x
}

现在,正如我之前提到的,我们会回到类。关于自定义grob类的好处是,您可以在它们被绘制之前拦截它们,以便进行最后一分钟的更改。为此,我们在grid中编写一个S3方法来makeContext函数,以进行相关更改。我知道这是一个很长的函数,但我尝试通过插入注释来使其更容易理解我正在尝试做什么。
makeContext.linetypeGrob <- function(x) {
  # Sort out line IDs
  id <- x$id
  if (is.null(id)) {
    if (is.null(x$id.lengths)) {
      id <- rep(1L, length(x$x))
    } else {
      id <- rep(seq_along(x$id.lengths), x$id.lengths)
    }
  }

  # Delete previous line IDs
  x$id <- NULL
  x$id.lengths <- NULL

  # Take dashes and breaks parameters out of the old grob
  dashes <- x$dashes
  x$dashes <- NULL
  breaks <- x$breaks
  x$breaks <- NULL

  # Convert to absolute units
  newx <- convertX(x$x, "mm", TRUE)
  newy <- convertY(x$y, "mm", TRUE)

  # Express lines as points along a cumulative distances
  dist <- sqrt(diff(newx)^2 + diff(newy)^2)
  cumdist <- cumsum(c(0, dist))

  # Take new lines as a sequence along the cumulative distance
  starts <- seq(0, max(cumdist), by = (dashes + breaks))
  ends <- seq(dashes, max(cumdist), by = (dashes + breaks))
  if (length(ends) == length(starts) - 1) {
    # Case when the end actually should have gone beyond `max(cumdist)`
    ends <- c(ends, max(cumdist))
  }

  # Set index for graphical parameters
  gp_i <- findInterval(starts, cumdist[cumsum(rle(id)$lengths)]) + 1

  # Basically dealing with elbow pieces a bit
  # Find mismatches between the original segments that starts and ends fall on
  start_id <- findInterval(starts, cumdist)
  end_id <- findInterval(ends, cumdist)
  mismatch <- which(start_id != end_id)

  # Insert elbow pieces
  starts <- c(starts, cumdist[end_id[mismatch]])
  starts <- starts[{o <- order(starts)}] # Need the order for later
  ends <- sort(c(ends, cumdist[end_id[mismatch]]))

  # Join elbow pieces
  new_id <- seq_along(start_id)
  if (length(mismatch)) {
    i <- rep_len(1, length(new_id))
    i[mismatch] <- 2
    new_id <- rep(new_id, i)
  }

  # Seperate lines with different IDs
  keepfun <- approxfun(cumdist, id)
  keep <- (keepfun(starts) %% 1) == 0 & (keepfun(ends) %% 1) == 0

  # Interpolate x
  xfun <- approxfun(cumdist, newx)
  x0 <- xfun(starts[keep])
  x1 <- xfun(ends[keep])

  # Interpolate y
  yfun <- approxfun(cumdist, newy)
  y0 <- yfun(starts[keep])
  y1 <- yfun(ends[keep])

  # Expand graphic parameters by new ID
  x$gp[] <- lapply(x$gp, function(x){
    if (length(x) == 1) {
      return(x)
    } else {
      x[as.integer(gp_i)]
    }
  })

  # Put everything back into the grob
  x$x <- unit(as.vector(rbind(x0, x1)), "mm")
  x$y <- unit(as.vector(rbind(y0, y1)), "mm")
  x$id <- as.vector(rbind(new_id[keep], new_id[keep]))
  class(x)[[1]] <- "polyline"
  x
}

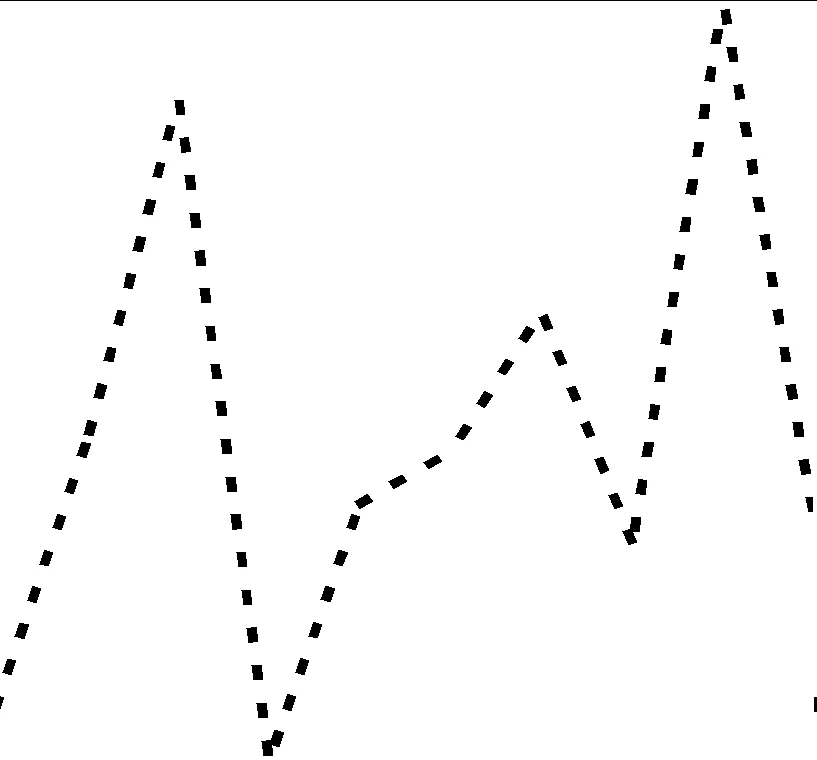
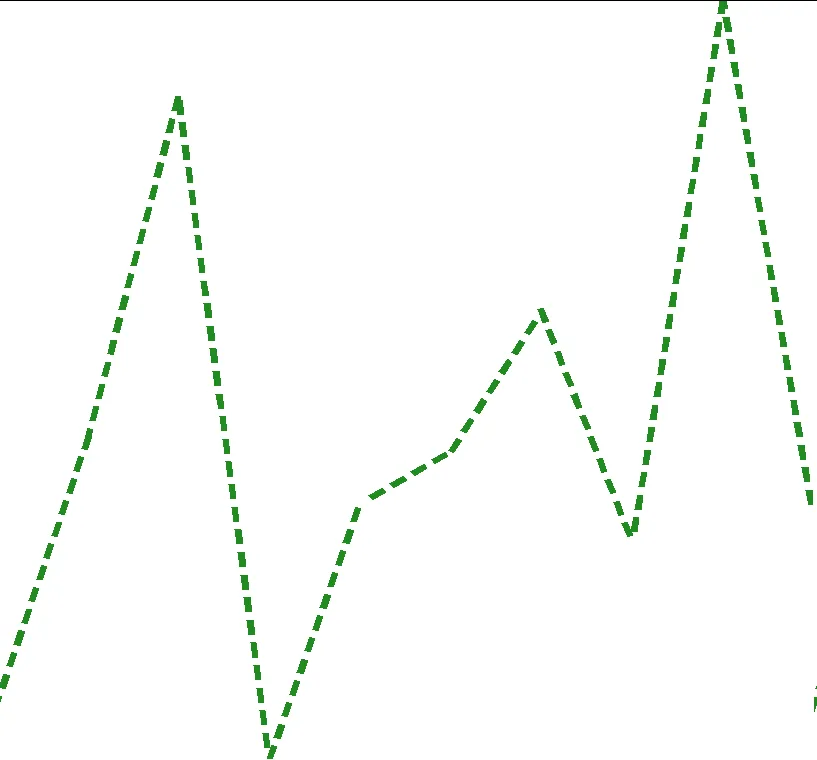
最后,为了证明它的工作原理,我会用这个新的grob绘制一些虚拟数据。你可以像绘制普通的折线grob一样使用它。
set.seed(100)
x <- c(cumsum(rnorm(10)), cumsum(rnorm(10)))
y <- c(cumsum(rnorm(10)), cumsum(rnorm(10)))
id <- rep(c(1, 2), each = 10)
gp <- gpar(lwd = c(2, 10), lineend = "butt",
           col = c("magenta", "blue"))


grob <- linetypeGrob(scales::rescale(x),
                     scales::rescale(y),
                     id = id, gp = gp, dashes = 5, breaks = 2)

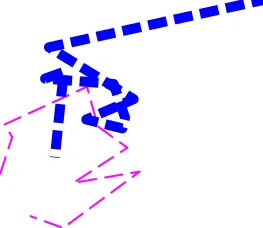
grid.newpage(); grid.draw(grob)

enter image description here

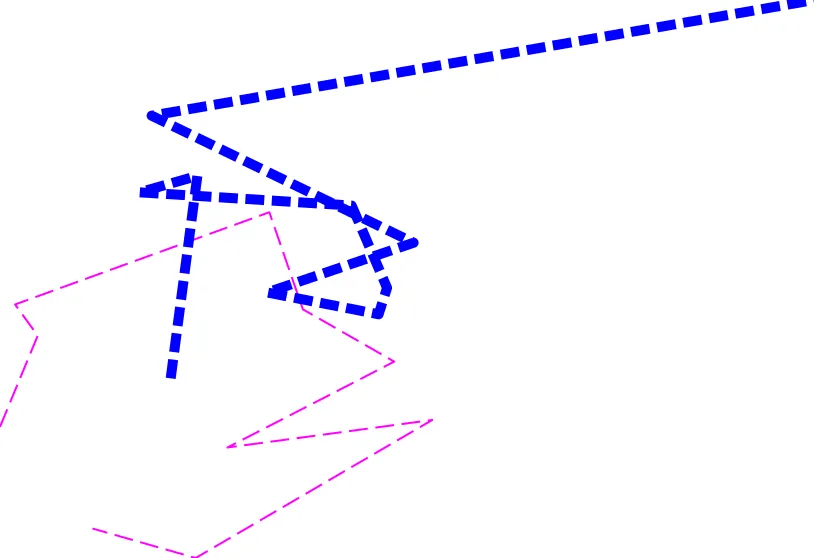
如果我调整设备大小,您可以看到破折号和间隔的长度仍然保持相等:

enter image description here


2
...并且因为你的“摆动”主题额外加了+2分——它让我想起了我去年患上的视网膜脱落。干杯 - Henrik
@Henrik 我也很喜欢这个。就像手绘的ggplot一样。 - Allan Cameron
1
@AllanCameron 是的,这正是为什么我需要控制线段之间间距的原因。我的意思是,人们可能可以没有线型来过日子,但如果有它们会很好。 - teunbrand
这个摆动主题很不错 - 你试过回答这里最受赞的问题之一吗?https://dev59.com/kWcs5IYBdhLWcg3wp1v3 :) 这里的几何图形和解决方案也可能对你的geom_pointpath(我称之为geom_trail)有用。 - tjebo
那个问题促使我开始整个项目,所以我考虑过了,但我怀疑它是否适用于所有情况。基本上,我可以编写单元测试,但我无法想象每种用例。但是,一旦一切都更加完善,我肯定会这样做。而且,我想使用approxfun来简化点路径/轨迹几何图形 :) - teunbrand
显示剩余3条评论

网页内容由stack overflow 提供, 点击上面的
可以查看英文原文,
原文链接