我需要帮助以编程方式绘制超过单个Excel系列容量的更多点。
根据http://office.microsoft.com/en-us/excel/HP100738491033.aspx,Excel 2007图表可显示的最大点数为256000。鉴于每个系列上限为32000个点,需要8个系列才能绘制完整的256000个点。由于我们处理的数据集很大,我的客户要求在每个图表中绘制最大数量的点。
我有C#/ Excel互操作的一定经验,因此认为编程创建工作表并循环遍历每组32000个点并将它们作为系列添加到图表中会很容易,直到完全绘制数据或绘制了8个系列。如果正确着色,则8个系列在视觉上与单个系列无法区分。
不幸的是,我现在遇到的主要问题是:
根据http://office.microsoft.com/en-us/excel/HP100738491033.aspx,Excel 2007图表可显示的最大点数为256000。鉴于每个系列上限为32000个点,需要8个系列才能绘制完整的256000个点。由于我们处理的数据集很大,我的客户要求在每个图表中绘制最大数量的点。
我有C#/ Excel互操作的一定经验,因此认为编程创建工作表并循环遍历每组32000个点并将它们作为系列添加到图表中会很容易,直到完全绘制数据或绘制了8个系列。如果正确着色,则8个系列在视觉上与单个系列无法区分。
不幸的是,我现在遇到的主要问题是:
(全尺寸) 2D图表中数据系列中可使用的最大数据点数为32,000... http://img14.imageshack.us/img14/9630/errormessagen.png
奇怪的是,当我执行这行代码时,弹出了这个窗口:
并伴随着:
HRESULT异常:0x800AC472 http://img21.imageshack.us/img21/5153/exceptionb.png
我不明白为什么在我甚至还没有指定要绘制的数据之前,我就会生成这样的弹出窗口/警告/异常。Excel在尝试聪明地做什么吗?
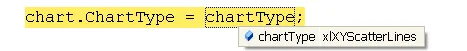
作为一个临时解决办法,我将chart.ChartType = chartType语句放入try-catch块中,以便我可以继续进行。
如下所示,我的“分块”代码正在按预期工作,但是当尝试向图表添加数据时,我仍然遇到相同的问题。Excel说我正在尝试绘制太多点,但很明显我并没有。
(全尺寸图片) 带监视窗口的代码块 http://img12.imageshack.us/img12/5360/snippet.png
我知道我可能还没有正确地将X值与每个系列关联起来,但在进一步操作之前,我正在尝试让它正常工作。
非常感谢任何帮助。
以下是完整的代码:
public void DrawScatterGraph(string xColumnLetter, string yColumnLetterStart, string yColumnLetterStop, string xAxisLabel, string yAxisLabel, string chartTitle, Microsoft.Office.Interop.Excel.XlChartType chartType, bool includeTrendline, bool includeLegend)
    {
        int totalRows = dataSheet.UsedRange.Rows.Count; //dataSheet is a private class variable that
                                                        //is already properly set to the worksheet
                                                        //we want to graph from

        if (totalRows < 2) throw new Exception("Not generating graph for " + chartTitle.Replace('\n', ' ')
                                            + " because not enough data was present");

        ChartObjects charts = (ChartObjects)dataSheet.ChartObjects(Type.Missing);
        ChartObject chartObj = charts.Add(100, 300, 500, 300);
        Chart chart = chartObj.Chart;

        try { chart.ChartType = chartType; }
        catch { }   //i don't know why this is throwing an exception, but i'm
                    //going to bulldoze through this problem temporarily

        if (totalRows < SizeOfSeries) //we can graph the data in a single series - yay!
        {
            Range xValues = dataSheet.get_Range(xColumnLetter + "2", xColumnLetter + totalRows.ToString());
            Range yValues = dataSheet.get_Range(yColumnLetterStart + "1", yColumnLetterStop + totalRows.ToString());
            chart.SetSourceData(yValues, XlRowCol.xlColumns);
            SeriesCollection seriesCollection = (SeriesCollection)chart.SeriesCollection(Type.Missing);
            foreach (Series s in seriesCollection)
            {
                s.XValues = xValues;
            }
        }
        else // we need to split the data across multiple series -- this doesn't work yet
        {
            int startRow = 1;
            while (startRow < totalRows)
            {
                int stopRow = (startRow + SizeOfSeries)-1;
                if (stopRow > totalRows) stopRow = totalRows;
                Range curRange = dataSheet.get_Range(yColumnLetterStart + startRow.ToString(), yColumnLetterStop + stopRow.ToString());
                try
                {
                    ((SeriesCollection)chart.SeriesCollection(Type.Missing)).Add(curRange, XlRowCol.xlColumns,
                                                                            Type.Missing, Type.Missing, Type.Missing);
                }
                catch (Exception exc)
                {
                    throw new Exception(yColumnLetterStart + startRow.ToString() + "!" + yColumnLetterStop + stopRow.ToString() + "!" + exc.Message);
                }
                startRow = stopRow+1;
            }
        }

        chart.HasLegend = includeLegend;
        chart.HasTitle = true;
        chart.ChartTitle.Text = chartTitle;

        Axis axis;
        axis = (Axis)chart.Axes(XlAxisType.xlCategory, XlAxisGroup.xlPrimary);
        axis.HasTitle = true;
        axis.AxisTitle.Text = xAxisLabel;
        axis.HasMajorGridlines = false;
        axis.HasMinorGridlines = false;

        axis = (Axis)chart.Axes(XlAxisType.xlValue, XlAxisGroup.xlPrimary);
        axis.HasTitle = true;
        axis.AxisTitle.Text = yAxisLabel;
        axis.HasMajorGridlines = true;
        axis.HasMinorGridlines = false;

        if (includeTrendline)
        {
            Trendlines t = (Trendlines)((Series)chart.SeriesCollection(1)).Trendlines(Type.Missing);
            t.Add(XlTrendlineType.xlLinear, Type.Missing, Type.Missing, 0, 0, Type.Missing, false, false, "AutoTrendlineByChameleon");
        }

        chart.Location(XlChartLocation.xlLocationAsNewSheet, "Graph");
    }