我希望在R中制作以下图形:
可以试试这个怎么样?
plot(c(0,1), c(0,1))
text(x = 0.5, y = 0.5, '{', srt = 90, cex = 8, family = 'Helvetica Neue UltraLight')
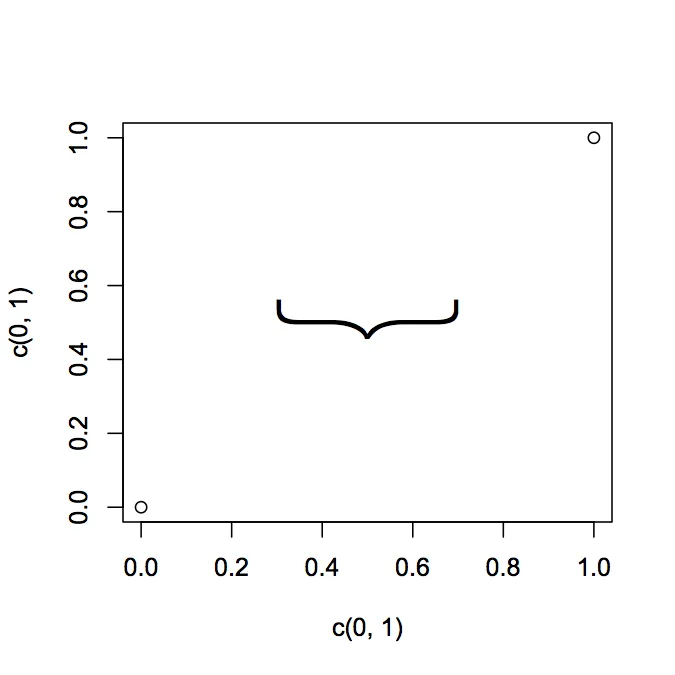
根据您的需求进行调整。您可能会发现更轻量级的字体或形状更好看。如果您在线搜索,可以找到毛细字体。
通过一些谷歌搜索,我找到了一个来自R帮助邮件列表的线程,其中包含了一些网格代码,点击此处可查看。至少它可以为您提供一些工作材料。以下是该帖子中的代码:
library(grid)

# function to draw curly braces in red
# x1...y2 are the ends of the brace
# for upside down braces, x1 > x2 and y1 > y2
Brack <- function(x1,y1,x2,y2,h)
{
   x2 <- x2-x1; y2 <- y2-y1
   v1 <- viewport(x=x1,y=y1,width=sqrt(x2^2+y2^2),
           height=h,angle=180*atan2(y2,x2)/pi,
           just=c("left","bottom"),gp=gpar(col="red"))
   pushViewport(v1)
   grid.curve(x2=0,y2=0,x1=.125,y1=.5,curvature=.5)
   grid.move.to(.125,.5)
   grid.line.to(.375,.5)
   grid.curve(x1=.375,y1=.5,x2=.5,y2=1,curvature=.5)
   grid.curve(x2=1,y2=0,x1=.875,y1=.5,curvature=-.5)
   grid.move.to(.875,.5)
   grid.line.to(.625,.5)
   grid.curve(x2=.625,y2=.5,x1=.5,y1=1,curvature=.5)
   popViewport()}
我认为pBrackets包是最优雅的解决方案。
如果要使用默认的绘图函数plot,请查看该包的vignettes以获取示例。
它们没有展示如何在ggplot2中使用。您可以尝试我的代码在stackoverflow这里,以在ggplot2图形中使用它。
最好的祝福, Pankil
# Function to create curly braces
# x, y position where to put the braces
# range is the widht
# position: 1 vertical, 2 horizontal
# direction: 1 left/down, 2 right/up
CurlyBraces <- function(x, y, range, pos = 1, direction = 1 ) {

    a=c(1,2,3,48,50)    # set flexion point for spline
    b=c(0,.2,.28,.7,.8) # set depth for spline flexion point

    curve = spline(a, b, n = 50, method = "natural")$y / 2

    curve = c(curve,rev(curve))

    a_sequence = rep(x,100)
    b_sequence = seq(y-range/2,y+range/2,length=100)

    # direction
    if(direction==1)
    a_sequence = a_sequence+curve
    if(direction==2)
    a_sequence = a_sequence-curve

    # pos
    if(pos==1)
    lines(a_sequence,b_sequence) # vertical
    if(pos==2)
    lines(b_sequence,a_sequence) # horizontal

    }

plot(0,0,ylim=c(-10,10),xlim=c(-10,10))
CurlyBraces(2, 0, 10, pos = 1, direction = 1 )
CurlyBraces(2, 0, 5,  pos = 1, direction = 2 )
CurlyBraces(1, 0, 10, pos = 2, direction = 1 )
CurlyBraces(1, 0, 5,  pos = 2, direction = 2 )
使用旋转选项 / 以及每行(也称为par)选项
我起初混淆了Sharon的答案和另一个带有更多可能性的新函数的答案。但是随后我加入了“shape”包到程序中,现在您可以将大括号放在任何想要的角度上。如果您有两个不在水平或垂直线上的点,而不使用shape==T,它会非常丑陋。
CurlyBraces <- function(
  # function to draw curly braces
  x=NA, y=NA,     # Option 1 (Midpoint) if you enter only x, y the position points the middle of the braces
  x1=NA, y1=NA,   # Option 2 (Point to Point) if you additionaly enter x1, y1 then x,y become one
                  #     end of the brace and x1,y1 is the other end
  range=NA,       # (Option 1 only) range is the length of the brace
  ang=0,          # (Option 1 only, only with shape==T) ang will set the angle for rotation
  depth = 1,      # depth controls width of the shape
  shape=T,        # use of package "shape" necessary for angles other than 0 and 90
  pos=1,          # (only if shape==F) position: 1 vertical, 2 horizontal
  direction=1,    # (only if shape==F)  direction: 1 left/down, 2 right/up
  opt.lines="lty=1,lwd=2,col='red'")   # All posible Options for lines from par (exept: xpd)
                  # enter as 1 character string or as character vector
  {

 if(shape==F){
  # only x & y are given so range is for length
  if(is.na(x1) | is.na(y1)){
    a_sequence = rep(x,100)
    b_sequence = seq(y-range/2,y+range/2,length=100)
    if (pos == 2){
      a_sequence = rep(y,100)
      b_sequence = seq(x-range/2,x+range/2,length=100)
    }
  }
  # 2 pairs of coordinates are given range is not needed
  if(!is.na(x1) & !is.na(y1)){
    if (pos == 1){
      a_sequence = seq(x,x1,length=100)
      b_sequence = seq(y,y1,length=100)
    }
    if (pos == 2){
      b_sequence = seq(x,x1,length=100)
      a_sequence = seq(y,y1,length=100)
    }
  }
  # direction
  if(direction==1)
    a_sequence = a_sequence+curve
  if(direction==2)
    a_sequence = a_sequence-curve

  # pos
  if(pos==1)
    lines(a_sequence,b_sequence, lwd=lwd, col=col, lty=lty,  xpd=NA) # vertical
  if(pos==2)
    lines(b_sequence,a_sequence, lwd=lwd, col=col, lty=lty, xpd=NA) # horizontal
}
 if(shape==T) {
  # Enable input of variables of length 2 or 4
  if(!("shape" %in% installed.packages())) install.packages("shape")
  library("shape")

  if(length(x)==2) {
    helpx <- x
    x<-helpx[1]
    y<-helpx[2]}
  if(length(x)==4) {
    helpx <- x
    x =helpx[1]
    y =helpx[2]
    x1=helpx[3]
    y1=helpx[4]
  }

  # Check input
  if((is.na(x) | is.na(y) )) stop("Set x & y")
  if((!is.na(x1) & is.na(y1)) | ((is.na(x1) & !is.na(y1))))stop("Set x1 & y1")
  if((is.na(x1) & is.na(y1)) & is.na(range)) stop("Set range > 0")

  a=c(1,2,3,48,50)    # set flexion point for spline
  b=c(0,.2,.28,.7,.8) # set depth for spline flexion point

  curve = spline(a, b, n = 50, method = "natural")$y * depth
  curve = c(curve,rev(curve))

  if(!is.na(x1) & !is.na(y1)){
    ang=atan2(y1-y,x1-x)*180/pi-90
    range = sqrt(sum((c(x,y) - c(x1,y1)) ^ 2))
    x = (x + x1)/2
    y = (y + y1)/2
  }

  a_sequence = rep(x,100)+curve
  b_sequence = seq(y-range/2,y+range/2,length=100)

  eval(parse(text=paste("lines(rotatexy(cbind(a_sequence,b_sequence),mid=c(x,y), angle =ang ),",
                        paste(opt.lines, collapse = ", ")
                        ,", xpd=NA)")))
 }
}


# # Some Examples with shape==T
# plot(c(),c(),ylim=c(-10,10),xlim=c(-10,10))
# grid()
#
# CurlyBraces(4,-2,4,2, opt.lines = "lty=1,col='blue' ,lwd=2")
# CurlyBraces(4,2,2,4, opt.lines = "col=2, lty=1 ,lwd=0.5")
# points(3,3)
# segments(4,2,2,4,lty =  2)
# segments(3,3,4,4,lty =  2)
# segments(4,2,5,3,lty =  2)
# segments(2,4,3,5,lty =  2)
# CurlyBraces(2,4,4,2, opt.lines = "col=2, lty=2 ,lwd=0.5") # Reverse entry of datapoints changes direction of brace
#
# CurlyBraces(2,4,-2,4, opt.lines = "col=3 , lty=1 ,lwd=0.5")
# CurlyBraces(-2,4,-4,2, opt.lines = "col=4 , lty=1 ,lwd=0.5")
# CurlyBraces(-4,2,-4,-2, opt.lines = "col=5 , lty=1 ,lwd=0.5")
# CurlyBraces(-4,-2,-2,-4, opt.lines = "col=6 , lty=1 ,lwd=0.5")
# CurlyBraces(-2,-4,2,-4, opt.lines = "col=7 , lty=1 ,lwd=0.5")
# CurlyBraces(2,-4,4,-2, opt.lines = "col=8 , lty=1 ,lwd=0.5")
#
# CurlyBraces( 7.5, 0, ang= 0 , range=5, opt.lines = "col=1 , lty=1 ,lwd=2 " )
# CurlyBraces( 5, 5, ang= 45 , range=5, opt.lines = "col=2 , lty=1 ,lwd=2 " )
# CurlyBraces( 0, 7.5, ang= 90 , range=5, opt.lines = "col=3, lty=1 ,lwd=2"  )
# CurlyBraces( -5, 5, ang= 135 , range=5, opt.lines = "col='blue' , lty=1 ,lwd=2 " )
# CurlyBraces( -7.5, 0, ang= 180 , range=5, opt.lines = "col=5 , lty=1 ,lwd=2 " )
# CurlyBraces( -5, -5, ang= 225 , range=5, opt.lines = "col=6 , lty=1 ,lwd=2"  )
# CurlyBraces( 0, -7.5, ang= 270 , range=5, opt.lines = "col=7, lty=1 ,lwd=2"  )
# CurlyBraces( 5, -5, ang= 315 , range=5, opt.lines = "col=8 , lty=1 ,lwd=2"  )
# points(5,5)
# segments(5,5,6,6,lty =  2)
# segments(7,3,3,7,lty =  2)
#
# # Or anywhere you klick
# locator(1) -> where  # klick 1 positions in the plot with your Mouse
# CurlyBraces( where$x[1], where$y[1], range=3, ang=45 , opt.lines = "col='blue' , depth=1, lty=1 ,lwd=2"  )
# locator(2) -> where  # klick 2 positions in the plot with your Mouse
# CurlyBraces( where$x[1], where$y[1], where$x[2], where$y[2],  opt.lines = "col='blue' , depth=2, lty=1 ,lwd=2"  )
#
# # Some Examples with shape == F
# plot(c(),c(),ylim=c(-10,10),xlim=c(-10,10))
# grid()
#
# CurlyBraces( 5, 0, shape=F, range= 10, pos = 1, direction = 1 , depth=5 ,opt.lines = " col='red' , lty=1 ,lwd=2"  )
# CurlyBraces(-5, 0, shape=F,  range= 5,  pos = 1, direction = 2 , opt.lines = "col='red' , lty=2 ,lwd=0.5")
# CurlyBraces( 1, 4, shape=F,  range= 6,  pos = 2, direction = 1 , opt.lines = "col='red' , lty=3 ,lwd=1.5")
# CurlyBraces(-1,-3, shape=F,  range= 5,  pos = 2, direction = 2 , opt.lines = "col='red' , lty=4 ,lwd=2"  )
#
#
# CurlyBraces( 4, 4, 4,-4, shape=F, pos=1, direction = 1 , opt.lines = "col='blue' , lty=1 ,lwd=2" )
# CurlyBraces(-4, 4,-4,-4, shape=F, pos=1, direction = 2 , opt.lines = "col='blue' , lty=2 ,lwd=0.5")
# CurlyBraces(-2, 5, 2, 5, shape=F, pos=2, direction = 1 , opt.lines = "col='blue' , lty=3 ,lwd=1.5")
# CurlyBraces(-2,-1, 4,-1, shape=F, pos=2, direction = 2 , opt.lines = "col='blue' , lty=4 ,lwd=2"  )
#
# # Or anywhere you klick
# locator(1) -> where  # klick 1 positions in the plot with your Mouse
# CurlyBraces( where$x[1], where$y[1], range=3, shape=F, pos=2, direction = 2 , opt.lines = "col='blue' , depth=1, lty=1 ,lwd=2"  )
# locator(2) -> where  # klick 2 positions in the plot with your Mouse
# CurlyBraces( where$x[1], where$y[1], where$x[2], where$y[2], shape=F, pos=2, direction = 2 , opt.lines = "col='blue' , depth=0.2, lty=1 ,lwd=2"  )
#
# # Some Examples with shape==T
# plot(c(),c(),ylim=c(-100,100),xlim=c(-1,1))
# grid()
#
# CurlyBraces(.4,-20,.4,20, depth=.1, opt.lines = "col=1 , lty=1 ,lwd=0.5")
# CurlyBraces(.4,20,.2,40, depth=.1, opt.lines = "col=2, lty=1 ,lwd=0.5")
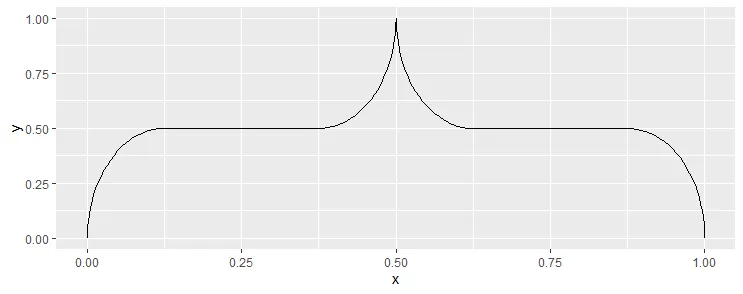
虽然回答有些晚,但对于那些感兴趣的人,您可以使用ggbrace包在ggplot2中添加括号。要安装和使用它,请查看下面的代码。您可以根据自己的喜好自定义括号,请参见ggbracegithub页面。
devtools::install_github("NicolasH2/ggbrace")
library(ggbrace)
library(ggplot2)

ggplot() + geom_brace(aes(x=c(0,1), y=c(0,1)))