多个imshow子图,每个都带有颜色条

34

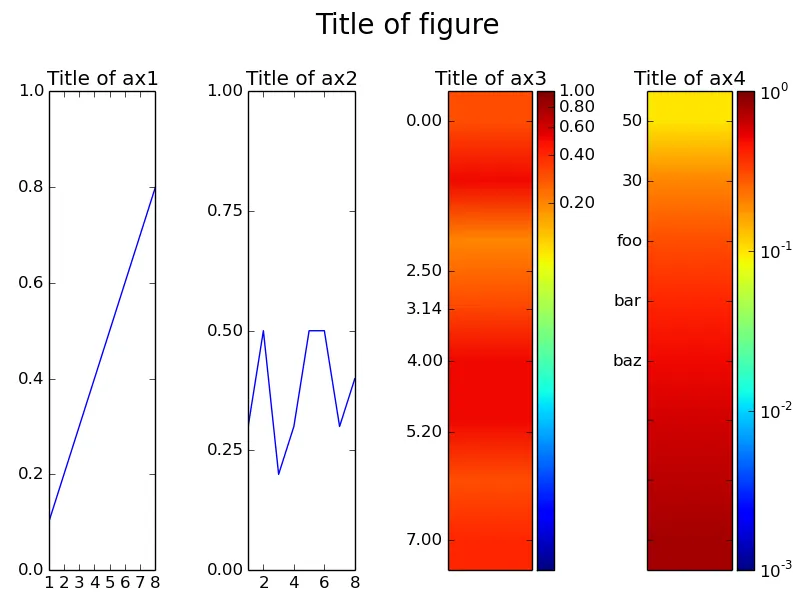
我希望有一个包含四个子图的图形,其中两个是常规的线图,另外两个是imshow图像。

我可以将imshow图像格式化为适当的图形本身,因为每个图像都需要自己的colorbar、修改后的轴和其他轴被删除。

然而,这似乎对subplot毫无用处。有人能帮我解决这个问题吗?

我使用以下代码将“常规”图形的数据显示为颜色映射(通过将输入数组缩放到[i,i,i,i,i,i]并调用imshow())。

下面的代码首先显示了我需要的子图,第二个则显示了我所能做的一切,但这还不足够。

#!/usr/bin/env python

import matplotlib.pyplot as plt
from matplotlib.colors import LogNorm

s = { 't':1, 'x':[1,2,3,4,5,6,7,8], 'D':[0.3,0.5,0.2,0.3,0.5,0.5,0.3,0.4] }
width = 40

# how I do it in just one plot
tot = []
for i in range(width):
    tot.append(s['D'])

plt.imshow(tot, norm=LogNorm(vmin=0.001, vmax=1))
plt.colorbar()
plt.axes().axes.get_xaxis().set_visible(False)
plt.yticks([0, 2, 4, 6], [s['x'][0], s['x'][2], s['x'][4], s['x'][6]])

plt.show()


f = plt.figure(figsize=(20,20))

plt.subplot(211)
plt.plot(s['x'], s['D'])
plt.ylim([0, 1])

#colorplot
sp = f.add_subplot(212)

#reshape (just necessary to see something)
tot = []
for i in range(width):
    tot.append(s['D'])

sp.imshow(tot, norm=LogNorm(vmin=0.001, vmax=1))

    #what I can't do now but needs to be done:
    #sp.colorbar()
#sp.axes().axes.get_xaxis().set_visible(False)
#sp.yticks([0, 200, 400, 600, 800, 1000], [s['x'][0], s['x'][200], s['x'][400], s['x'][600], s['x'][800], s['x'][1000]])

plt.show()

你的示例无法运行!你能添加一些s和tot的样本数据,以便我们看到你正在查看什么吗?为了完整起见,每个示例结束时都应该有show命令。 - Steve Barnes
抱歉,我已经附加了可运行的代码。 - michael
你不需要那些cla命令。此外,在发布示例时,最好绘制随机数据(除非问题取决于数据的确切值)。 - tacaswell
请将此代码简化为最少量,以显示您的问题。 - tacaswell
以下是有关程序设计的内容,请将其翻译成中文。 - michael
1个回答

55
您可以使用matplotlib的面向对象接口而不是状态机接口,以便更好地控制每个轴。此外,为了控制色条的高度/宽度,您可以利用matplotlib的AxesGrid工具包。
例如:
import matplotlib.pyplot as plt
import numpy as np
from mpl_toolkits.axes_grid1 import make_axes_locatable
from matplotlib.colors import LogNorm
from matplotlib.ticker import MultipleLocator

s = {'t': 1,
     'x': [1, 2, 3, 4, 5, 6, 7, 8],
     'T': [0.1, 0.2, 0.3, 0.4, 0.5, 0.6, 0.7, 0.8],
     'D': [0.3, 0.5, 0.2, 0.3, 0.5, 0.5, 0.3, 0.4]}

width = 40

tot = np.repeat(s['D'],width).reshape(len(s['D']), width)
tot2 = np.repeat(s['T'],width).reshape(len(s['D']), width)

fig, (ax1, ax2, ax3, ax4) = plt.subplots(1,4)

fig.suptitle('Title of figure', fontsize=20)

# Line plots
ax1.set_title('Title of ax1')
ax1.plot(s['x'], s['T'])
ax1.set_ylim(0,1)

ax2.set_title('Title of ax2')
ax2.plot(s['x'], s['D'])
# Set locations of ticks on y-axis (at every multiple of 0.25)
ax2.yaxis.set_major_locator(MultipleLocator(0.25))
# Set locations of ticks on x-axis (at every multiple of 2)
ax2.xaxis.set_major_locator(MultipleLocator(2))
ax2.set_ylim(0,1)

ax3.set_title('Title of ax3')
# Display image, `aspect='auto'` makes it fill the whole `axes` (ax3)
im3 = ax3.imshow(tot, norm=LogNorm(vmin=0.001, vmax=1), aspect='auto')
# Create divider for existing axes instance
divider3 = make_axes_locatable(ax3)
# Append axes to the right of ax3, with 20% width of ax3
cax3 = divider3.append_axes("right", size="20%", pad=0.05)
# Create colorbar in the appended axes
# Tick locations can be set with the kwarg `ticks`
# and the format of the ticklabels with kwarg `format`
cbar3 = plt.colorbar(im3, cax=cax3, ticks=MultipleLocator(0.2), format="%.2f")
# Remove xticks from ax3
ax3.xaxis.set_visible(False)
# Manually set ticklocations
ax3.set_yticks([0.0, 2.5, 3.14, 4.0, 5.2, 7.0])

ax4.set_title('Title of ax4')
im4 = ax4.imshow(tot2, norm=LogNorm(vmin=0.001, vmax=1), aspect='auto')
divider4 = make_axes_locatable(ax4)
cax4 = divider4.append_axes("right", size="20%", pad=0.05)
cbar4 = plt.colorbar(im4, cax=cax4)
ax4.xaxis.set_visible(False)
# Manually set ticklabels (not ticklocations, they remain unchanged)
ax4.set_yticklabels([0, 50, 30, 'foo', 'bar', 'baz'])

plt.tight_layout()
# Make space for title
plt.subplots_adjust(top=0.85)
plt.show()

enter image description here


你可以使用上面的示例中的 set_ticksset_ticklabels 方法更改任意轴上的刻度位置和标签。

关于make_axes_locatable函数的作用,来自AxesGrid工具包的matplotlib网站

The axes_divider module provides a helper function make_axes_locatable, which can be useful. It takes a existing axes instance and create a divider for it.

ax = subplot(1,1,1)
divider = make_axes_locatable(ax)

make_axes_locatable returns an instance of the AxesLocator class, derived from the Locator. It provides append_axes method that creates a new axes on the given side of (“top”, “right”, “bottom” and “left”) of the original axes.


1
https://dev59.com/8GYq5IYBdhLWcg3wui0z#14261698 <- 我的回答,关于状态机和面向对象编程。 - tacaswell
make_axis_locatable 究竟是做什么的? - michael
除此之外,我需要调整图像本身的yticks,以便目前的yticks是字段的索引,但它们代表一定范围的bin,因此我想将其写在轴上而不是索引。有没有一种方法可以替换yticks? - michael
如果我正确理解您的最后一条评论,您正在寻找“set_ticklabels”方法。我已在示例(最右侧轴)中使用了此方法。您可以向该方法提供所需标签的列表。如果列表比刻度数少(如我的示例),则其余的刻度标签为空字符串,即它们不会显示。 - sodd
太完美了,看起来现在就像我想要的样子。谢谢(回答有些延迟,抱歉)。 - michael

网页内容由stack overflow 提供, 点击上面的
可以查看英文原文,
原文链接