下面的代码示例提供了一种相对于其他轴缩放每个轴的方法。但是,为了这样做,需要修改Axes3D.get_proj函数。以下是基于Matplotlib提供的示例的示例:http://matplotlib.org/1.4.0/mpl_toolkits/mplot3d/tutorial.html#line-plots
(此答案最后有一个较短的版本)
from mpl_toolkits.mplot3d.axes3d import Axes3D
from mpl_toolkits.mplot3d import proj3d
import matplotlib as mpl
import numpy as np
import matplotlib.pyplot as plt
scale_x = 1.0
scale_y = 2.0
scale_z = 3.0
max_scale=max(scale_x, scale_y, scale_z)
scale_x=scale_x/max_scale
scale_y=scale_y/max_scale
scale_z=scale_z/max_scale
scale = np.array([[scale_x,0,0,0],
[0,scale_y,0,0],
[0,0,scale_z,0],
[0,0,0,1]])
print scale
def get_proj_scale(self):
"""
Create the projection matrix from the current viewing position.
elev stores the elevation angle in the z plane
azim stores the azimuth angle in the x,y plane
dist is the distance of the eye viewing point from the object
point.
"""
relev, razim = np.pi * self.elev/180, np.pi * self.azim/180
xmin, xmax = self.get_xlim3d()
ymin, ymax = self.get_ylim3d()
zmin, zmax = self.get_zlim3d()
worldM = proj3d.world_transformation(
xmin, xmax,
ymin, ymax,
zmin, zmax)
R = np.array([0.5, 0.5, 0.5])
xp = R[0] + np.cos(razim) * np.cos(relev) * self.dist
yp = R[1] + np.sin(razim) * np.cos(relev) * self.dist
zp = R[2] + np.sin(relev) * self.dist
E = np.array((xp, yp, zp))
self.eye = E
self.vvec = R - E
self.vvec = self.vvec / proj3d.mod(self.vvec)
if abs(relev) > np.pi/2:
V = np.array((0, 0, -1))
else:
V = np.array((0, 0, 1))
zfront, zback = -self.dist, self.dist
viewM = proj3d.view_transformation(E, R, V)
perspM = proj3d.persp_transformation(zfront, zback)
M0 = np.dot(viewM, worldM)
M = np.dot(perspM, M0)
return np.dot(M, scale);
Axes3D.get_proj=get_proj_scale
"""
You need to include all the code above.
From here on you should be able to plot as usual.
"""
mpl.rcParams['legend.fontsize'] = 10
fig = plt.figure(figsize=(5,5))
ax = fig.gca(projection='3d')
theta = np.linspace(-4 * np.pi, 4 * np.pi, 100)
z = np.linspace(-2, 2, 100)
r = z**2 + 1
x = r * np.sin(theta)
y = r * np.cos(theta)
ax.plot(x, y, z, label='parametric curve')
ax.legend()
plt.show()
标准输出:
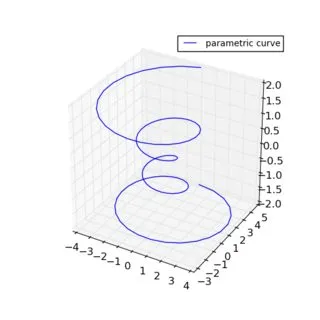
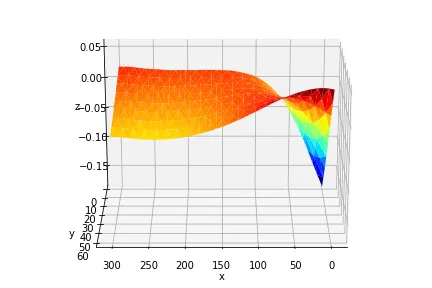
缩放比例为 (1, 2, 3):
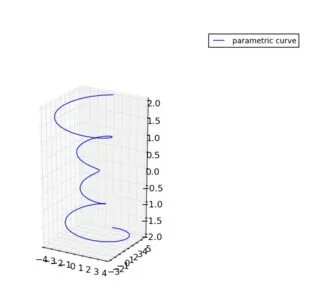
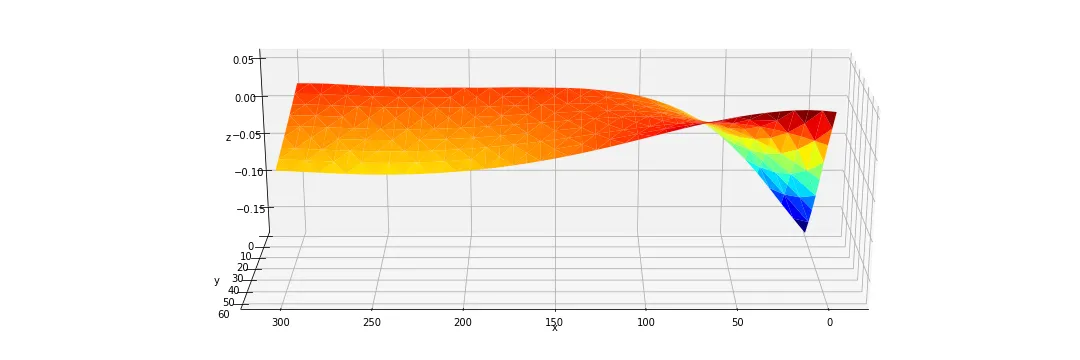
缩放比例为 (1, 1, 3):
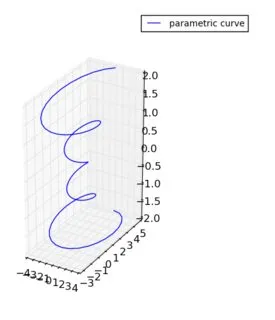
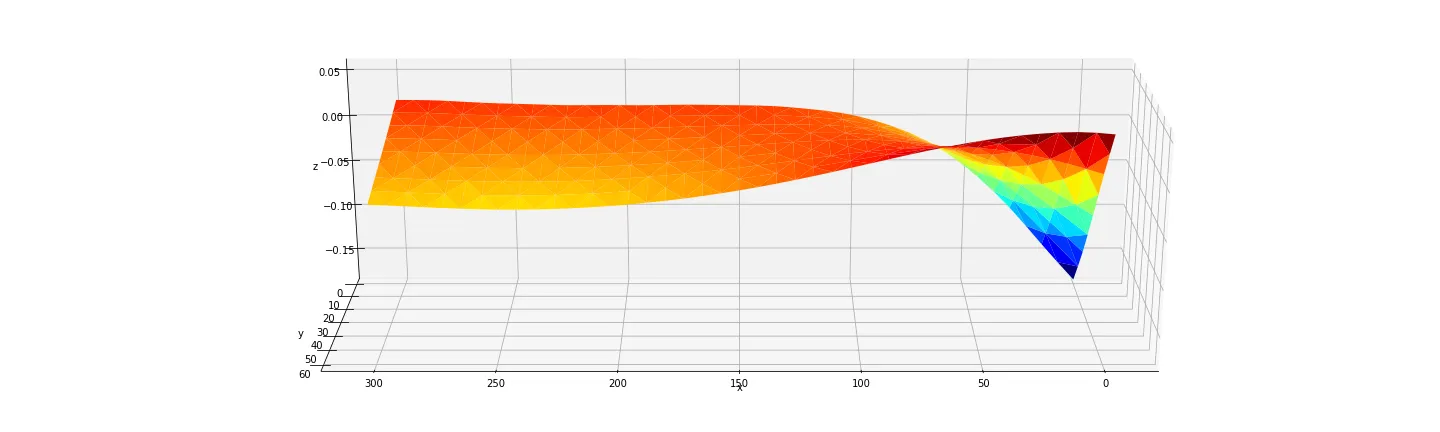
我特别喜欢这种方法的原因是,将 z 和 x 交换位置,缩放比例为 (3, 1, 1):
以下是代码的简化版本。
from mpl_toolkits.mplot3d.axes3d import Axes3D
from mpl_toolkits.mplot3d import proj3d
import matplotlib as mpl
import numpy as np
import matplotlib.pyplot as plt
mpl.rcParams['legend.fontsize'] = 10
fig = plt.figure(figsize=(5,5))
ax = fig.gca(projection='3d')
theta = np.linspace(-4 * np.pi, 4 * np.pi, 100)
z = np.linspace(-2, 2, 100)
r = z**2 + 1
x = r * np.sin(theta)
y = r * np.cos(theta)
"""
Scaling is done from here...
"""
x_scale=1
y_scale=1
z_scale=2
scale=np.diag([x_scale, y_scale, z_scale, 1.0])
scale=scale*(1.0/scale.max())
scale[3,3]=1.0
def short_proj():
return np.dot(Axes3D.get_proj(ax), scale)
ax.get_proj=short_proj
"""
to here
"""
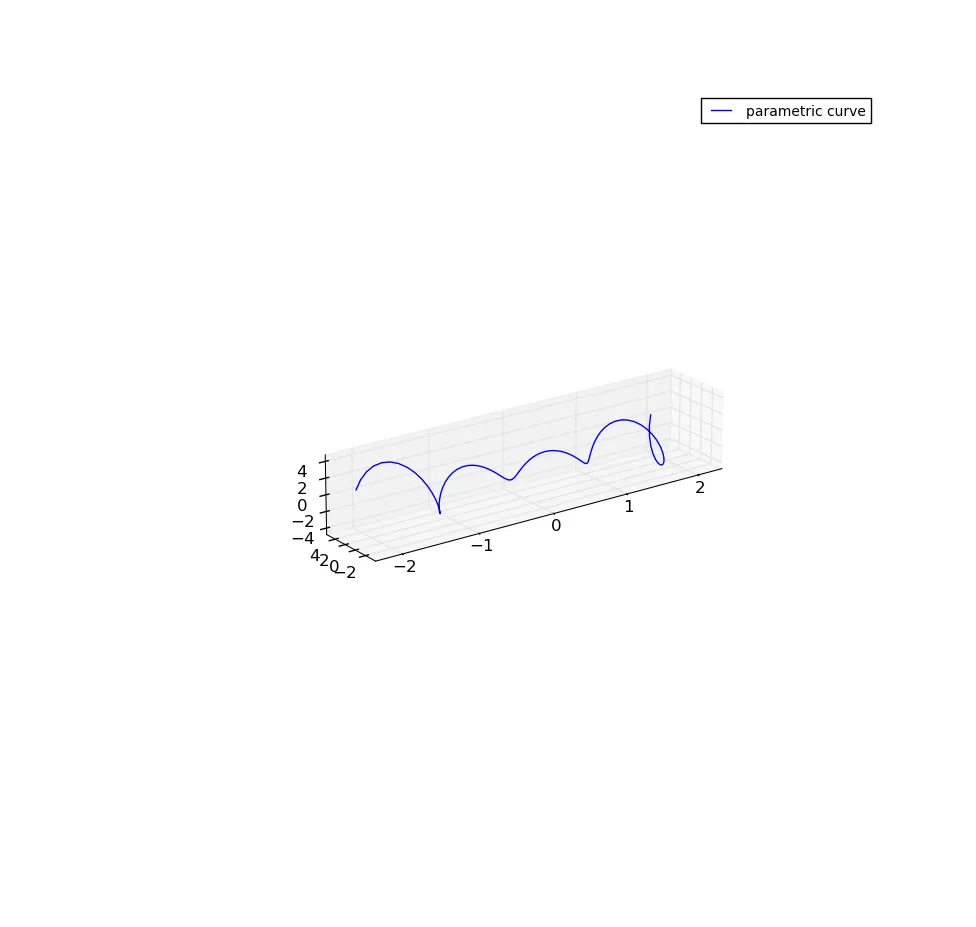
ax.plot(z, y, x, label='parametric curve')
ax.legend()
plt.show()
 我想做的是将Z轴拉伸9倍,保持X和Y不变。但我想保持相同的坐标。

set_zlim(z_min, z_max)吗?或者是set_zlim3d? - wflynnyhere1的被接受的答案修改了轴的纵横比。这是一种hack方法,因此您需要修改matplotlib的文件。默认情况下似乎不允许使用不同的纵横比。 - Imanol Luengo