我使用Python编写了以下代码,以在由PyQt5生成的GUI中显示一个条形图。
import sys
from PyQt5.QtWidgets import QDialog, QApplication, QPushButton, QVBoxLayout, \
QLineEdit, QMessageBox, QInputDialog, QLabel, QHBoxLayout, QGridLayout,     QStackedLayout, QFormLayout
from  PyQt5 import QtCore, QtGui, QtWidgets
import time
import matplotlib
matplotlib.use("TkAgg")
from matplotlib.lines import Line2D

import matplotlib.animation as animation
from matplotlib.backends.backend_qt5agg import FigureCanvasQTAgg as FigureCanvas
from matplotlib.backends.backend_qt5agg import NavigationToolbar2QT as     NavigationToolbar
import matplotlib.pyplot as plt
# data
import numpy as np
#import matplotlib.pyplot as plt
import pandas as pd
import os
import csv

#define  the path to data
pathToData='C:/RC/python/data/'
dataName= '31122017ARB.csv'
# import
data=pd.read_csv(pathToData+dataName, delimiter=';',encoding='cp1252')


# percent  MW
data['MWP']=data[' MW ']/sum(data[' MW '])
#aggregate by   Best
datag=data.groupby('Best', as_index=False).agg({'MW': 'sum'})
x=["BE"+s for s in[str(s) for s in [int(x) for x in datag.iloc[:,0].tolist()]]]
y=datag.ix[:,1].tolist()


figure = plt.figure()

H = np.array([[100, 2, 39, 190], [402, 55, 369, 1023], [300, 700, 8, 412], [170, 530, 330, 1]])
Z = np.array([[3, 290, 600, 480], [1011, 230, 830, 0], [152, 750, 5, 919], [340, 7, 543, 812]])


class Window(QDialog):
    def __init__(self, parent=None):
        super(Window, self).__init__(parent)

        # a figure instance to plot on
        self.figure = plt.figure()

        # this is the Canvas Widget that displays the `figure`
        # it takes the `figure` instance as a parameter to __init_
        self.im = None
        self.canvas = FigureCanvas(self.figure)

        self.canvas.mpl_connect('button_press_event', self.on_button_press_event)

        # this is the Navigation widget
        # it takes the Canvas widget and a parent
        self.toolbar = NavigationToolbar(self.canvas, self)

        self.timer = QtCore.QTimer(self)
        self.timer.timeout.connect(self.plot)
        self.timer.setInterval(5000)

        # Just some button connected to `plot` method
        self.button = QPushButton('Plot')
        self.button.clicked.connect(self.timer.start)
        self.button.setDefault(False)

        self.stop = QPushButton("Stop")
        self.stop.clicked.connect(self.timer.stop)
        self.stop.setDefault(False)

        self.exit = QPushButton('Exit')
        self.exit.clicked.connect(self.close)
        self.exit.setDefault(True)

         layout = QFormLayout()
        layout.addWidget(self.toolbar)
        layout.addWidget(self.canvas)
        layout.addWidget(self.button)
        layout.addWidget(self.stop)
        layout.addWidget(self.exit)

        self.setLayout(layout)

        self.lb = QtWidgets.QLabel(self)
        self.lb.setWindowFlags(QtCore.Qt.ToolTip)

            def plot(self):
        self.x  = ["BE"+s for s in[str(s) for s in [int(x) for x in datag.iloc[:,0].tolist()]]]
        self.y  = datag.iloc[:,1].tolist()#np.sin(self.x)

        self.setWindowTitle("Bestandseingruppierung")

    def update_figure(self):
        self.axes.bar(self.x, self.y)
        #self.y = np.roll(self.y,-1)
        #self.draw()
        self.canvas.draw()
    def on_button_press_event(self, event):
        print('button={}, x={}, y={}, xdata={}, ydata={}'
            .format(event.button, event.x, event.y, event.xdata, event.ydata))

       if self.im:
                message = str(self.im.get_cursor_data(event))
                delay = 1000
                w = self.lb.fontMetrics().width(message)
                self.lb.resize(w, self.lb.size().height())
                self.lb.setText(message)
                self.lb.move(QtGui.QCursor.pos())
                self.lb.show()
                QtCore.QTimer.singleShot(delay, self.lb.hide)


    if __name__ == '__main__':
        app = QApplication(sys.argv)

        main = Window()
        main.show()

        sys.exit(app.exec_())
问题在于:没有显示任何图形,甚至我没有收到任何错误提示。我只得到了一个空的
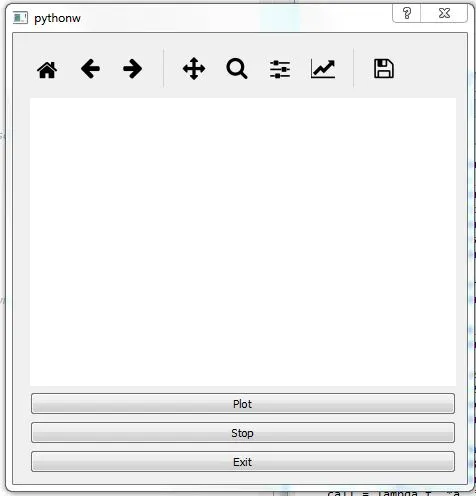 。
。如何在按下绘图按钮时获取图表?我猜想,在
def plot(self):下面我做错了些什么。仅为澄清:我在由PyQt5生成的GUI中测试了该图表,作为独立代码完全正常运行。
# FigureCanvas inherits QWidget
class MainWindow(FigureCanvas):
    def __init__(self, parent=None, width=4, height=3, dpi=100):
        fig = Figure(figsize=(width, height), dpi=dpi)
        self.axes = fig.add_subplot(111)
        self.axes.hold(False)

        super(MainWindow, self).__init__(fig)
        self.setParent(parent)

        FigureCanvas.setSizePolicy(self,
                                   QSizePolicy.Expanding,
                                   QSizePolicy.Expanding)
        FigureCanvas.updateGeometry(self)

        timer = QTimer(self)
        timer.timeout.connect(self.update_figure)
        timer.start(50)

        self.x  = ["BE"+s for s in[str(s) for s in [int(x) for x in datag.iloc[:,0].tolist()]]]#np.arange(0, 4*np.pi, 0.1)
        self.y  = datag.iloc[:,1].tolist()#np.sin(self.x)

        self.setWindowTitle("Best")

    def update_figure(self):
        self.axes.bar(self.x, self.y)
        #self.y = np.roll(self.y,-1)
        self.draw()

if __name__ == '__main__':
    import sys
    app = QApplication(sys.argv)
    mainWindow = MainWindow()

    mainWindow.show()
sys.exit(app.exec_())
update_figure()方法后更新你的图表。 - MrLeeh