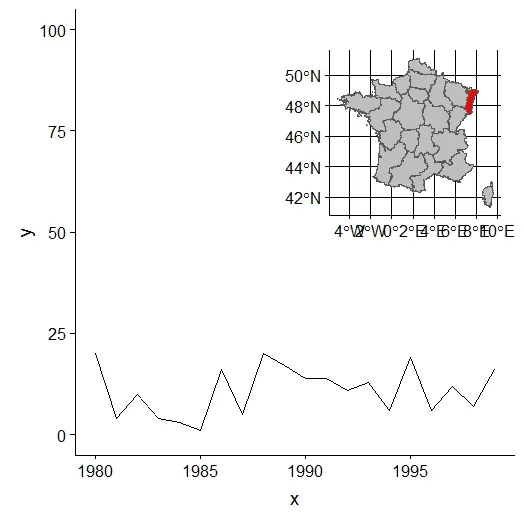
如果我想在绘图中绘制地图,我会这样做:
对于每个图,我希望添加地图作为插图。
library(ggplot2)
library(sf)
library(cowplot)
library(gridExtra)
library(raster)

df <- data.frame(x = 1980:1999, y = sample(1:20, 20, replace = T))
shp.dat <- getData('GADM', country='FRA', level=1)

shp.dat <- shp.dat %>% st_as_sf()

p <- ggplot(df, aes(x = x, y = y)) + geom_line() + ylim(0, 100)
p.shp <- ggplot() +
        geom_sf(data = shp.dat, fill = ifelse(shp.dat$ID_1 == 1,"red", "grey"))
inset_map <- ggdraw() + draw_plot(p, 0, 0, 1, 1) + draw_plot(p.shp, 0.5, 0.52, 0.5, 0.4)
inset_map
现在我有四个图,我已经这样绘制了它们
  df <- data.frame(x = 1980:1999,
                 y1 = sample(1:20, 20, replace = T),
                 y2 = sample(1:20, 20, replace = T),
                 y3 = sample(1:20, 20, replace = T),
                 y4 = sample(1:20, 20, replace = T))


p1 <- ggplot(df, aes(x = x, y = y1)) + geom_line() + ylim(0, 100)
p2 <- ggplot(df, aes(x = x, y = y2)) + geom_line() + ylim(0, 100)
p3 <- ggplot(df, aes(x = x, y = y3)) + geom_line() + ylim(0, 100)
p4 <- ggplot(df, aes(x = x, y = y4)) + geom_line() + ylim(0, 100)

pp <- grid.arrange(p1, p2, p3, p4, ncol = 2)
对于每个图,我希望添加地图作为插图。
inset_map <- ggdraw() + draw_plot(pp, 0, 0, 1, 1) + draw_plot(p.shp, 0.5, 0.52, 0.5, 0.4)
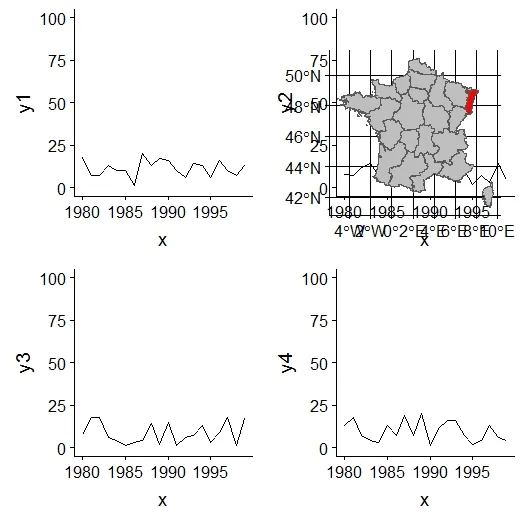
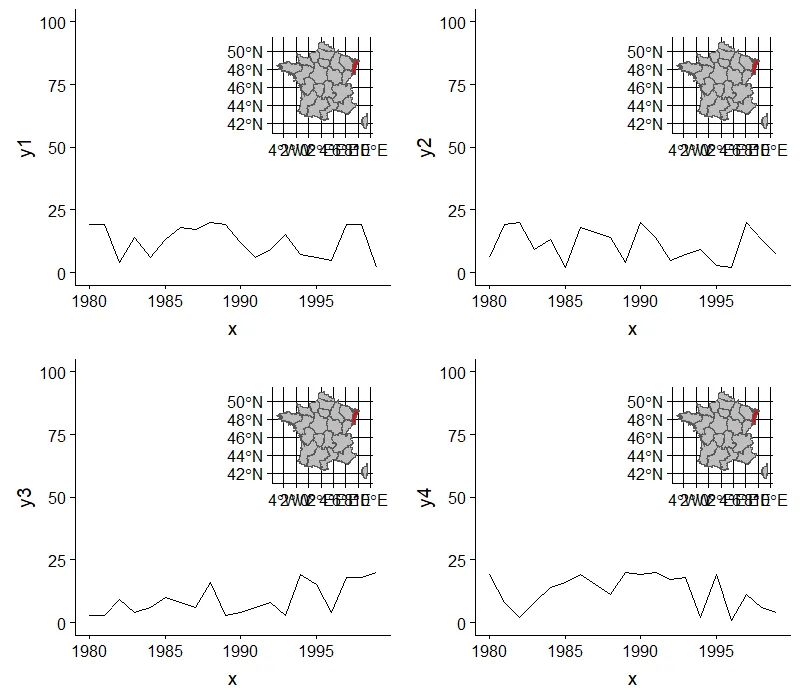
如何在每个图中单独显示地图插图?
您如何将地图作为插图嵌入到每个单独的绘图中?
请注意,保留了HTML标签。
getData函数是来自raster包吗? - Z.Lin