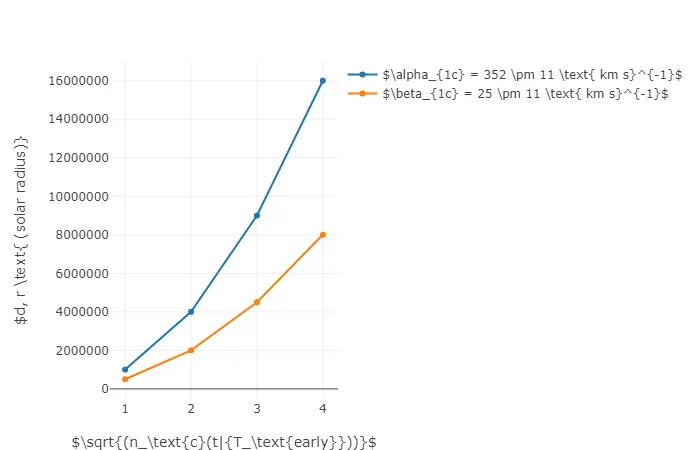
我在下面的示例图中遇到了两个互斥的问题。
- y轴标签和y刻度标签重叠在一起。我没有找到任何方法来移动它们,我希望图形的大小可以扩展以容纳必要的间距。
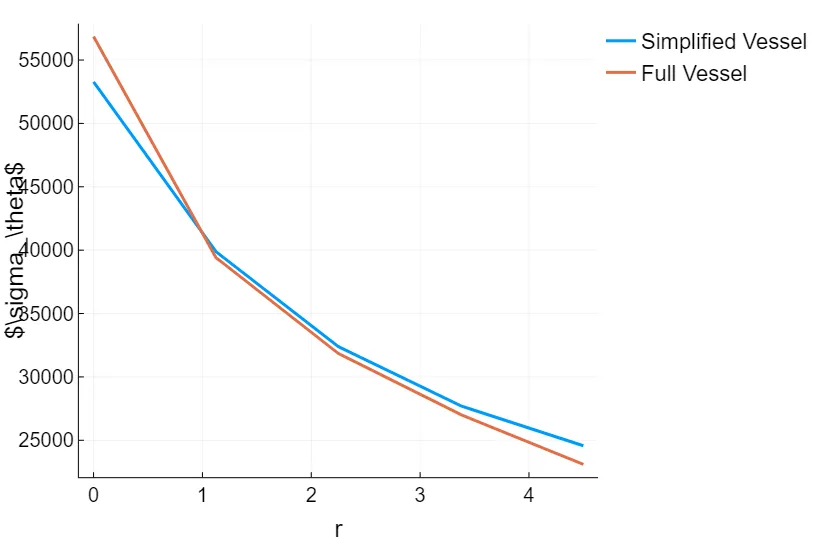
- 我想让y轴标签为sigma,带有下标theta。看起来Unicode不允许下标theta。我希望通过使用LaTeXStrings来解决这个限制。然而,我无法使LatexString以正确的形式展开到图表中。请注意,问题#1会在有或没有LatexString作为ylabel时发生,并且对于其他字符串值,LatexString扩展也无法工作。
下面提供了示例绘图、代码和数据,以便复现。我正在Windows上使用Juno编辑器与Plotly后端。
using Plots, DelimitedFiles, LaTeXStrings
plotly(linewidth=3,titlefont=18,legendfont=16,guidefont=18,tickfont=14,formatter=:plain)
data=readdlm("hoopstress.txt",skipstart=1)
r=data[:,2]
σθ=data[:,end-1:end]
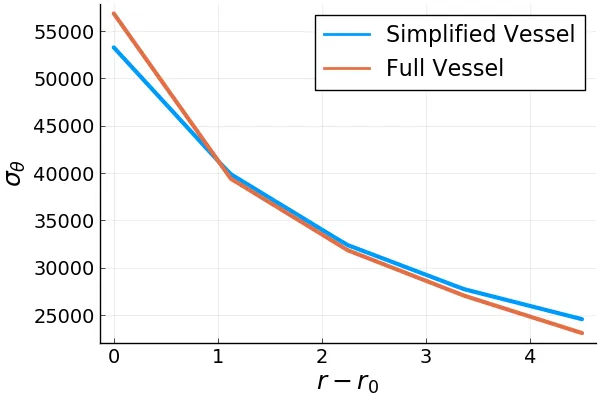
plot(r,σθ,label=["Simplified Vessel" "Full Vessel"],xlabel="r",ylabel=L"\sigma_\theta")
    Length  Simple  Full
1   0.  53280   56859
2   9.4e-2  52158   55405
3   0.1875  51036   53951
4   0.28125 49915   52498
5   0.375   48793   51044
6   0.46875 47671   49590
7   0.5625  46550   48136
8   0.65625 45428   46682
9   0.75    44307   45228
10  0.84375 43185   43774
11  0.9375  42063   42320
12  1.0312  40942   40866
13  1.125   39883   39411
14  1.2187  39256   38780
15  1.3125  38629   38150
16  1.4062  38002   37519
17  1.5 37375   36888
18  1.5938  36748   36257
19  1.6875  36121   35627
20  1.7813  35494   34996
21  1.875   34867   34365
22  1.9688  34239   33735
23  2.0625  33612   33104
24  2.1562  32985   32473
25  2.25    32389   31842
26  2.3437  31998   31441
27  2.4375  31607   31039
28  2.5312  31216   30637
29  2.625   30825   30235
30  2.7187  30434   29833
31  2.8125  30043   29431
32  2.9062  29652   29029
33  3.  29261   28628
34  3.0938  28870   28226
35  3.1875  28479   27824
36  3.2813  28088   27422
37  3.375   27714   27020
38  3.4688  27452   26693
39  3.5625  27190   26367
40  3.6563  26927   26040
41  3.75    26665   25714
42  3.8438  26403   25387
43  3.9375  26141   25061
44  4.0313  25879   24734
45  4.125   25617   24408
46  4.2187  25354   24081
47  4.3125  25092   23755
48  4.4062  24830   23428
49  4.5 24568   23102
"\n"作为绘图标签中的换行符,但GR和Plotly不会。此外,在LaTeX字符串内部,"\n"也无法正常工作。 - Nathan Boyer