使用ggplot2:同时使用科学计数法和完整数字

3

我有一个ggplot2的图表,是通过以下方法生成的直方图:

  library("ggplot2")
  library("scales")
  df <- data.frame(test = rnorm(1000, 1000, 40000))
  p <- ggplot(df, aes(x = test)) + geom_histogram(colour="black", fill="#FF9999")
  # set themes, axes and labels
  p <- p + theme_minimal() + theme() + xlab("Distance travelled [km]") + ylab("Count of users") 


  # transformation
  p <- p + scale_x_log10(breaks = trans_breaks("log10", function(x) {10^x}),
                       labels = trans_format("log10", math_format(10^.x))
  )

  # plot
  p

输出: enter image description here

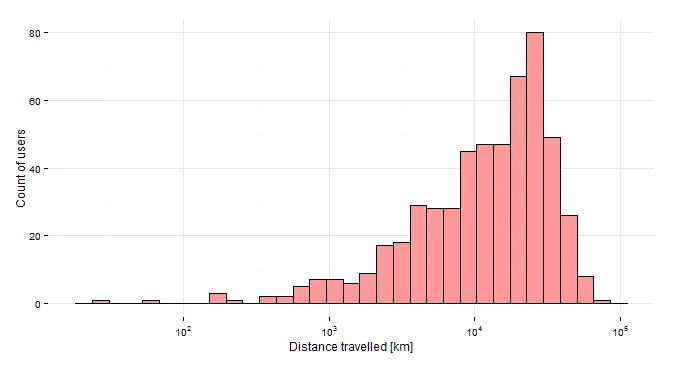
我使用了 scales 包将 x 轴标签显示为十的幂,但实际上,只要数字低于,比如10^4和10^-4,我希望将它们显示为小数。对于下面的绘图,这将给出以下轴标签。

100
1000
10^4
10^5

我该如何在trans_format()内完成这个任务,或者有其他更好的解决方案吗?

2
请提供一个可重现的示例。 - Jonas Tundo
修改了我的示例代码。 - grssnbchr
1个回答

3
你可以使用ifelse来在identitytrans_format之间进行分支:
f <- function (x) ifelse(log10(x)<4,identity(x),trans_format("log10",math_format(10^.x))(x))
> f(10^(1:6))
[[1]]
[1] 10

[[2]]
[1] 100

[[3]]
[1] 1000

[[4]]
10^`4`

[[5]]
10^`5`

[[6]]
10^`6`

p + scale_x_log10(breaks = trans_breaks("log10", function(x) {10^x}), labels=f)

谢谢,非常好用。尽管我不太明白 trans_format("log10",math_format(10^.x))(x) 的确切作用是什么。trans_format 返回一个被立即调用的函数吗? - grssnbchr
@wnstnsmth 是的,尽管它只是通过对 f 的调用来调用。 - James

网页内容由stack overflow 提供, 点击上面的
可以查看英文原文,
原文链接