我想改变BA、SLG的外观顺序,变成SLG、BA。我发现有类似的问题,但是我的解决方案可能行不通,因为我已经在Excel中汇总了数据。因此,我的数据框架可能不同。无论如何,我尝试实施这个方法都没有成功:
df2 <- factor(df, levels = c("SLG","BA"))
df <- read.table(textConnection(
  'POS SLG BA
  2B    0.4632 .23
  3B    0.468652174 .24
  SS    0.4146 .22
  1B    0.472368421 .25
  RF    0.462684211 .245
  CF    0.4435 .225
  LF    0.4474 .226
  C 0.440875  .228
  DH    0.508714286 .28'), header = TRUE,stringsAsFactors = FALSE)


library(micromapST)
library(ggplot2)
library(tidyr)
library(dplyr)
df$POS <- reorder(as.factor(df$POS), df$SLG)
dfx <- gather(df, group, data, SLG, BA)
row.names(df) <- NULL

theme_set(theme_grey() +
            theme(plot.title = element_text(hjust=0.5,face='bold'),
                  axis.title.y = element_text(angle = 0, vjust = 0.5,face='bold'),
                  axis.title.x=element_text(face='bold'),
                  panel.background = element_rect(fill = "gray"),
                  axis.ticks=element_blank()))


plot <- ggplot(dfx, aes(x = data, y = POS, group = group, fill = POS))+
  labs(title = "Position vs Slugging Percentage", x = "SLG", y = "Position") +
  geom_point(shape = 21, size = 3) +
  theme(plot.title = element_text(hjust = 0.5),
        plot.subtitle = element_text(hjust = 0.5),
        plot.caption = element_text(hjust = -0.5),
        legend.position = "",
        strip.text.y = element_blank(),
        strip.background = element_rect(fill = rgb(.9,.95,1),
                                        colour = gray(.5), size=.2),
        panel.border = element_rect(fill = FALSE, colour=gray(.75)),
        panel.grid.minor.x = element_blank(),
        panel.grid.minor.y = element_blank(),
        panel.spacing.x = unit(0.07,"cm"),
        panel.spacing.y = unit(0.07,"cm"),
        axis.ticks = element_blank(),
        axis.text = element_text(colour = "black"),
        axis.text.y = element_text(size = rel(.78), face = "bold",
                                   margin = margin(0,0,0,3)),
        axis.text.x = element_text(margin = margin(-1,0,3,0))) +
  facet_grid(~group, scale = "free")

plot
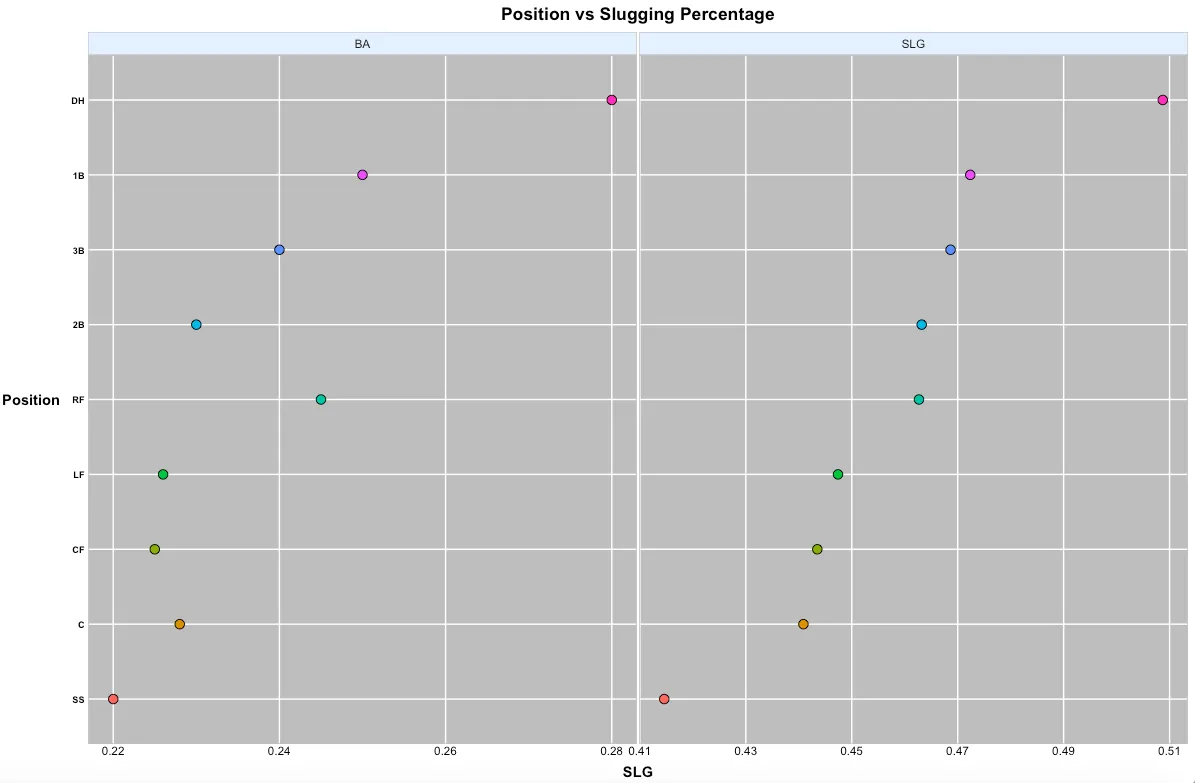
dfx <- gather(df, group, data, SLG, BA)之后,执行dfx$group = factor(dfx$group, levels=c("SLG","BA"))。 - eipi10group。 - eipi10