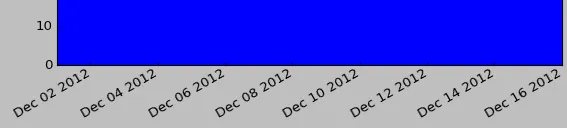
我想编辑x轴上日期的格式。下面的图片展示了默认情况下条形图上日期的显示方式,我希望删除“Dec”和“2012”的重复,并只在x轴上显示实际的日期数字。
有什么建议可以做到这一点吗?
我想编辑x轴上日期的格式。下面的图片展示了默认情况下条形图上日期的显示方式,我希望删除“Dec”和“2012”的重复,并只在x轴上显示实际的日期数字。
有什么建议可以做到这一点吗?
简而言之:
import matplotlib.dates as mdates
myFmt = mdates.DateFormatter('%d')
ax.xaxis.set_major_formatter(myFmt)
matplotlib网站上有很多示例。我最常使用的是这里
ax.xaxis 而是使用 plt.<command> 的替代方法? - 3kstcax 在 @Robino 的答案中已经定义。 - khaverimplt.gca().xaxis.set_major_formatter(myFmt)。该代码行的作用是将myFmt格式应用于当前坐标轴的主刻度线上的x轴标签。 - charelf虽然Paul H给出的答案涵盖了重要部分,但它不是一个完整的例子。另一方面,matplotlib示例看起来相当复杂,而且没有展示如何使用天数。
所以对于每个需要的人,这里是一个完整的实例:
from datetime import datetime
import matplotlib.pyplot as plt
from matplotlib.dates import DateFormatter

myDates = [datetime(2012,1,i+3) for i in range(10)]
myValues = [5,6,4,3,7,8,1,2,5,4]
fig, ax = plt.subplots()
ax.plot(myDates,myValues)

myFmt = DateFormatter("%d")
ax.xaxis.set_major_formatter(myFmt)

## Rotate date labels automatically
fig.autofmt_xdate()
plt.show()
从包matplotlib.dates中,可以应用日期格式到坐标轴标签和绘图的刻度上,就像这个示例所展示的一样。
下面是一个为多个子图标记坐标轴刻度的示例:
import matplotlib.pyplot as plt
import matplotlib.dates as mdates
import pandas as pd

df = pd.read_csv('US_temp.csv')
plt.plot(df['Date'],df_f['MINT'],label='Min Temp.')
plt.plot(df['Date'],df_f['MAXT'],label='Max Temp.')
plt.legend()
####### Use the below functions #######
dtFmt = mdates.DateFormatter('%b') # define the formatting
plt.gca().xaxis.set_major_formatter(dtFmt) # apply the format to the desired axis
plt.show()
import matplotlib.pyplot as plt
from matplotlib.ticker import (MultipleLocator, FormatStrFormatter,
AutoMinorLocator)
import matplotlib.dates as mdates
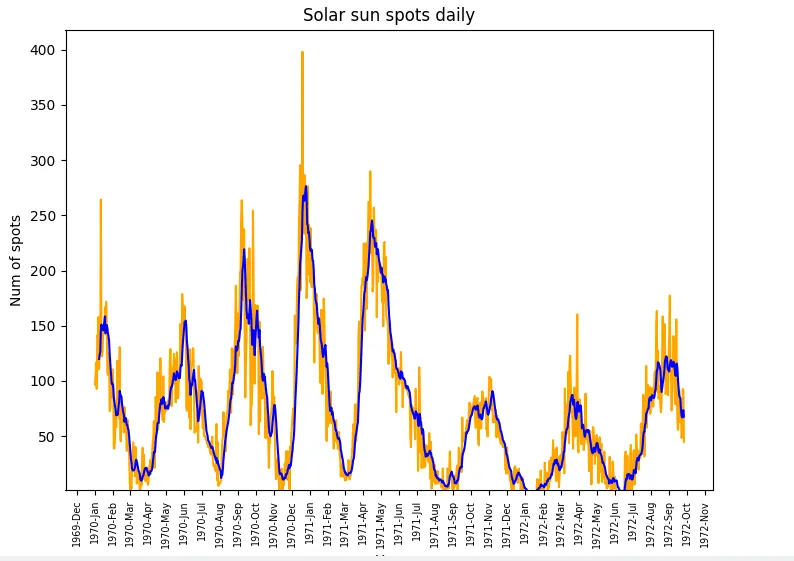
dtFmt = mdates.DateFormatter('%Y-%b') # define the formatting
plt.gca().xaxis.set_major_formatter(dtFmt)
# show every 12th tick on x axes
plt.gca().xaxis.set_major_locator(mdates.MonthLocator(interval=1))
plt.xticks(rotation=90, fontweight='light', fontsize='x-small',)